
IB Economics PPC Explained
IB Economics PPC explained with real-world analogies, trade-offs, and graph insights. Learn why every economic choice comes with a cost.
IB ECONOMICS HLIB ECONOMICSIB ECONOMICS SLIB ECONOMICS INTRODUCTION
Lawrence Robert
5/13/202514 min read
The Production Possibility Curve: Life's Most Honest Graph
Target Question:
What is the Production Possibility Curve in IB Economics?
Secondary target Questions:
What does a point inside the PPC mean?
What is the difference between actual growth and potential growth on a PPC?
What causes a PPC to shift outward?
The Graph That Tells You What You Already Know
Here's a story you already know the ending to.
Let's imagine for a sec it's the night before your IB Economics mock exam. You've got roughly six hours until your alarm goes off, and you're faced with a choice that feels unfair: revise the entire AD/AS model, or go to your mate's birthday thing that "will only be two hours, maximum" (it won't be two hours).
You can't do both.
Whatever you choose, there is one thing you need to give up. If you revise, you miss the party. If you go to the party, you probably spend the next morning staring at a question about market power you feel like it's written in ancient Sumerian.
That trade-off - the unavoidable cost of every decision - is the entire point of the Production Possibility Curve. Economists just confuse you a bit more by dressing it up in a fancy graph.
The PPC is one of the first proper diagrams you'll master in IB Economics, and it's also one of the most important. It captures something genuinely true about how economies work: resources are limited, choices have consequences, and you can't have everything.
Let's get into it.
So What Is the PPC?
IB Economics definition - The Production Possibility Curve (also called the PPF, or Production Possibility Frontier - a different name for the same thing):
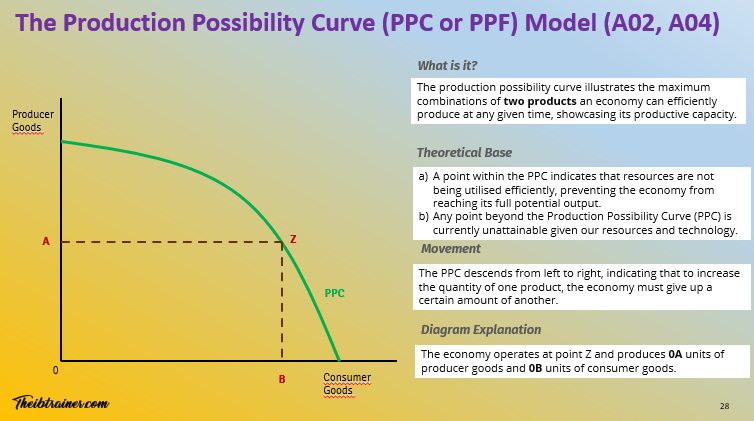
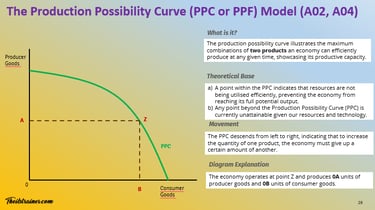
Shows the maximum combinations of two products an economy can efficiently produce at any given time, illustrating its productive capacity.
It's essentially a picture of an economy's productive capacity - the absolute upper limit of what it can produce, given the resources and technology it currently has.
The UK economy, at any given moment, has a fixed amount of land, labour, capital, and entrepreneurship. It can use those resources to produce different combinations of things. More hospitals, fewer tanks. More schools, fewer motorways. More renewable energy infrastructure, less consumer goods production. But it cannot produce beyond its current capacity - not without changing something fundamental.
The PPC makes that limit visible.
Reading the Diagram: Points A, B, C and Y
DIAGRAM 1: Basic PPC - Points On, Inside, and Outside the Curve [PPC diagram showing a concave curve with Point A and Point B on the curve, Point C inside the curve, and Point Y beyond the curve. Axes: Capital Goods (vertical) and Consumer Goods (horizontal). Label Point Z showing 0A units of capital goods and 0B units of consumer goods.] Source visit: IB Economics Diagrams
Let's say our economy produces just two things: capital goods (machines, factories, infrastructure - things that help produce other things) and consumer goods (everything you actually use - phones, food, Netflix subscriptions... fine, the device you watch Netflix on).
Here's what each point on the diagram tells you:
Point ON the curve (e.g. Point A or Point B): The economy is operating at maximum efficiency. All resources are fully employed, nothing is being wasted, and the economy is producing as much as it possibly can given current constraints. This is where we want to be.
Point INSIDE the curve (Point C):
A point inside the PPC indicates that resources are not being fully utilised - the economy is producing below its potential.
The economy is underperforming. Some resources are sitting idle - workers are unemployed, factories are standing empty, land is unused. This could be because of a recession, a pandemic shutting down industries, or simply poor resource allocation. The economy could produce more; it's just not producing more right now.
Point OUTSIDE the curve (Point Y): This is currently unattainable - beyond what the economy can achieve given its existing resources and technology. It's not impossible forever - the curve can shift outward (more on that below) - but right now, it's out of reach.
Opportunity Cost: The Heart of the Model
Here's where the PPC earns a nice place in the IB Economics syllabus.
If the economy is at Point A and decides it wants to produce more consumer goods, it has to give something up - specifically, some capital goods. As it moves along the curve from Point A to Point B, it sacrifices capital goods to gain consumer goods.
That sacrifice is the opportunity cost - the value of the next best alternative you give up when you make a choice.
The PPC makes opportunity cost unavoidable. Every single point on the curve represents a choice, and every choice comes with a cost.
IB Economics Real-life example: When the UK government massively scaled up NHS capacity during COVID-19, diverting resources to healthcare required trade-offs elsewhere - delayed infrastructure projects, paused non-essential public services, enormous borrowing that constrained future spending choices. The PPC was playing out in real time, on the front pages of every newspaper.
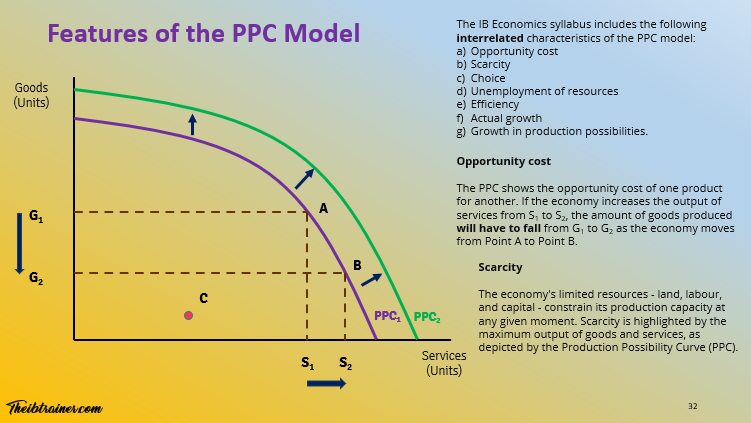
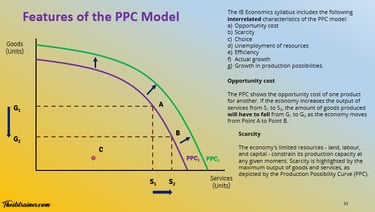
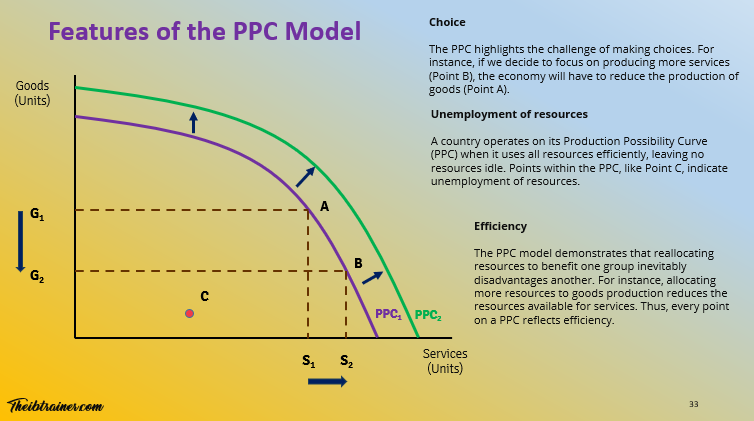
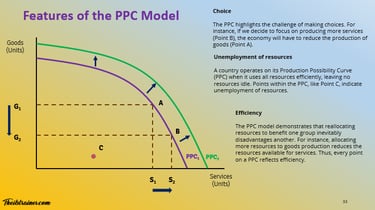
If the economy increases the output of services from S1 to S2, the amount of goods produced will fall from G1 to G2 - the economy moves from Point A to Point B. More of one, less of the other. That's the deal.
Curved vs Straight: Increasing vs Constant Opportunity Cost
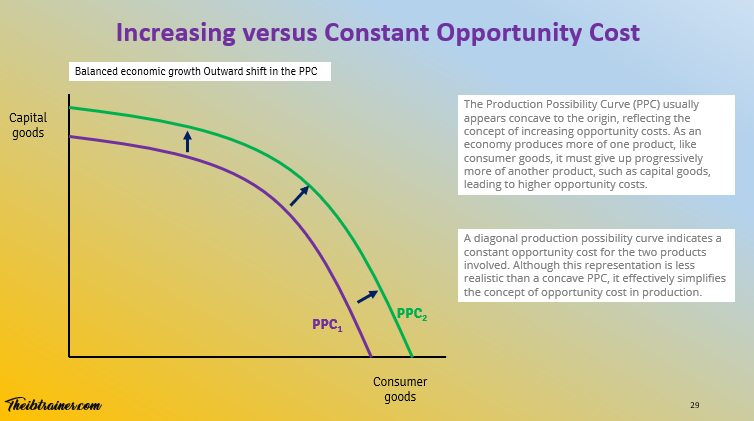
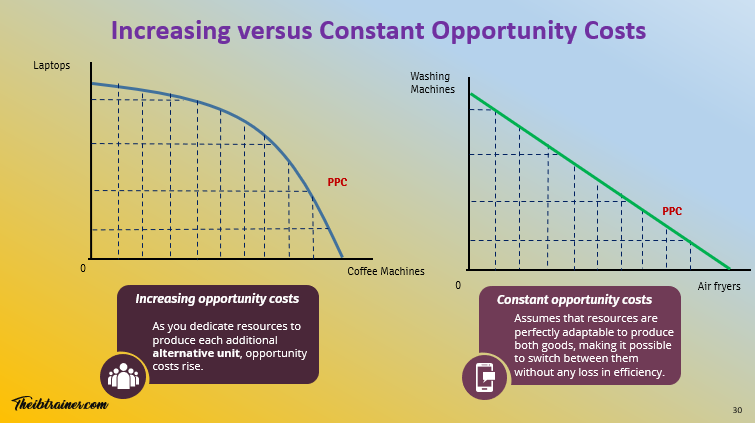
DIAGRAM 2: Constant vs Increasing Opportunity Cost two PPC diagrams side by side: (1) a straight-line diagonal PPC showing constant opportunity cost; (2) a concave PPC showing increasing opportunity cost. Label both clearly.
Not all PPCs look the same. The shape tells you something important about how costly it is to switch production between the two goods.
The Curved PPC: Increasing Opportunity Costs
This is the realistic version - and the one you'll draw in your IB Economics exams. The PPC is concave to the origin, meaning it bows outward.
IB Economics definition - Concave PPC:
A concave PPC reflects increasing opportunity costs - as the economy produces more of one good, it must sacrifice progressively more of the other.
Why the curve? Because resources are not perfectly suited to producing all things equally well.
Some workers are brilliant engineers. Some are talented teachers. Some are gifted surgeons. If the government suddenly decides it needs more engineers and tries to convert teachers and surgeons into engineers overnight, the conversion doesn't go smoothly - those resources aren't perfectly adaptable. You lose a lot of teaching and medical capacity, and you gain relatively little engineering capacity. The opportunity cost increases as you push further towards one type of production.
This is why the PPC bows outward: as you produce more of one product, you must sacrifice progressively more of the other. Resources are specialists, not generalists.
The Straight-Line PPC: Constant Opportunity Costs
A diagonal (straight-line) PPC assumes that every unit of one good you sacrifice produces exactly the same additional amount of the other good - that resources are perfectly adaptable between uses, with no efficiency loss.
This is tidier. But it's also largely unrealistic. In the real world, switching resources between industries almost always involves friction, retraining costs, and efficiency losses. But the straight-line PPC is useful for simplifying opportunity cost concepts, and it does appear in some specific contexts (like when two goods use resources in identical proportions).
For your IB Economics exam: draw the concave curve unless specifically told otherwise.
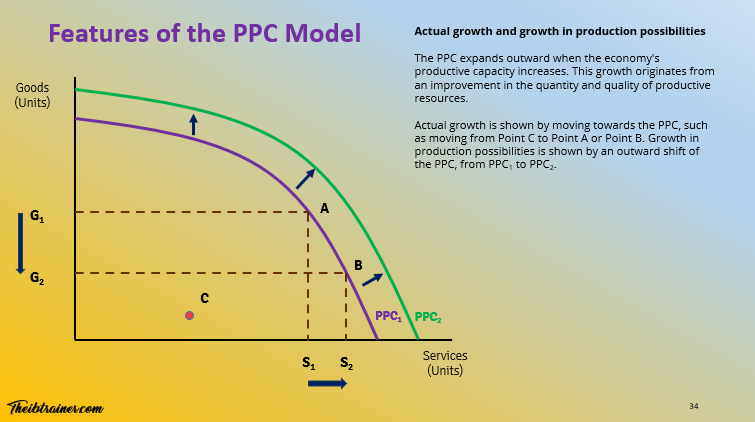
Shifts in the PPC: When the Economy Grows (or Shrinks)
DIAGRAM 3: PPC Shifts - Outward and Inward PPC diagram showing: (1) a parallel outward shift from PPC1 to PPC2, labelled as growth in production possibilities; (2) a parallel inward shift showing a decrease in production possibilities. Include movement from Point C to Point B on PPC1 as actual growth.
The curve isn't fixed forever. It can move.
Shifting Outward: Growth in Production Possibilities
When an economy's productive capacity increases - meaning it can now produce more of both goods - the entire PPC shifts outward.
IB Economics definition - Growth in Production Possibilities:
Growth in production possibilities is shown by an outward shift of the PPC, caused by improvements in the quantity or quality of productive resources.
This is called growth in production possibilities (or potential growth).
Actual growth is represented by movement from inside the PPC to a point on the curve - reducing unemployment within existing productive capacity.
What causes an outward shift?
Better technology: A major technological breakthrough - say, AI-assisted manufacturing or green energy innovations - means the economy can produce more output from the same resources
More resources: Discovering new oil fields, population growth expanding the labour force, or investment increasing the capital stock
Better quality resources: Education and training that improve human capital, so workers become more skilled and productive
Improved infrastructure: Better transport, energy, and telecoms networks that make production more efficient
IB Economics Real-life example: South Korea's economy in the 1960s and 70s was one of the poorest in the world. Through massive government investment in education, technology, and infrastructure, it shifted its PPC outward so dramatically that it's now one of the world's most advanced economies - home to Samsung, Hyundai, and LG. An extraordinary, exam-ready example of potential growth over time.
Shifting Inward: Decrease in Production Possibilities
The PPC can also move the wrong way. A pandemic wiping out a significant portion of the workforce, a major war destroying capital and infrastructure, a severe drought devastating agricultural capacity, or a "brain drain" as skilled workers emigrate to another country looking for better conditions - all of these reduce an economy's productive capacity and shift the PPC inward.
Post-conflict reconstruction in countries like Iraq or Libya has involved exactly this: trying to rebuild a PPC that war had collapsed inward.
Non-Parallel Shifts: When Growth Is Lopsided
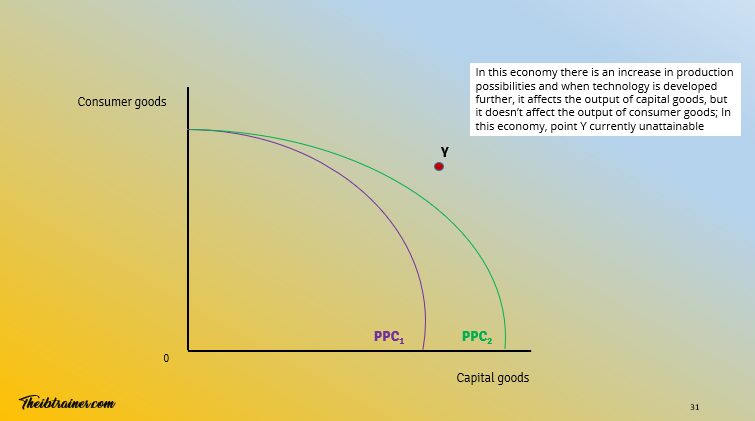
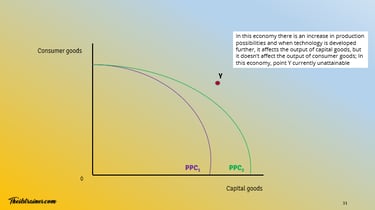
DIAGRAM 4: Non-Parallel PPC Shift PPC diagram showing a non-parallel outward shift - the PPC pivots outward on one axis only (e.g. capital goods axis), showing that technological progress has only improved the production of capital goods, not consumer goods. Point Y was previously unattainable but now becomes attainable.
Here's a syllabus area that IB Economics examiners usually enjoy testing: what happens when an improvement in technology only affects one type of production?
Imagine that a breakthrough in automation dramatically increases an economy's capacity to produce capital goods (machines, industrial equipment) - but has no impact on the production of consumer goods. The PPC doesn't shift outward symmetrically. Instead, it pivots - rotating outward from one end, extending the boundary only along the capital goods axis.
A point like Point Y - previously unattainable - may now become achievable, but only because of the expanded capacity in capital goods specifically.
This is your non-parallel shift, and it's a nice piece of diagram analysis that will impress an examiner who's been marking mediocre PPCs all morning.
Actual Growth vs Growth in Production Possibilities
Let's be precise about two terms that the IB Economics syllabus distinguishes carefully:
Actual growth means the economy moves from a point inside the PPC to a point on the PPC - from underperformance to full efficiency. It's not that the economy can produce more; it's that it's finally using what it already has. Moving from Point C (unemployment) to Point A or Point B on the existing curve. This happens when, for example, unemployment falls as a recession ends and workers return to employment.
Growth in production possibilities (potential growth) means the entire PPC shifts outward - the economy's maximum capacity has expanded. This requires improvements in the quantity or quality of productive resources.
This point is highly relevant: you can have actual growth without potential growth (just by reducing unemployment), and you can have potential growth without actual growth (if new capacity sits unused because of a lack of demand). A recession-hit economy with enormous spare capacity is a typical case of actual growth potential sitting unrealised inside the curve.
All Seven Features of the PPC Model
The IB Economics syllabus identifies seven key interrelated features of the PPC. Here's a clean summary:
1. Opportunity cost: Every move along the PPC involves sacrificing some of one good to gain more of another. The curve makes this trade-off explicit and quantifiable.
2. Scarcity: The curve itself represents scarcity. You cannot produce beyond it, because resources - land, labour, capital - are finite at any given time.
3. Choice: The economy must choose which point on the PPC to aim for. More consumer goods or more capital goods? More healthcare or more defence? Every allocation decision is a choice.
4. Unemployment of resources: Any point inside the PPC (like Point C) indicates that some resources are unemployed or inefficiently used. The economy is capable of more, but isn't achieving it.
5. Efficiency:
Every point on the PPC is productively efficient - resources are fully and optimally deployed.
Moving resources from one point to another benefits one sector at the direct expense of another. You can't gain without someone else losing, at any given point on the curve.
6. Actual growth: Represented by a movement from inside the PPC to the curve - reducing unemployment and improving efficiency within existing productive capacity.
7. Growth in production possibilities: Represented by an outward shift of the entire PPC - the economy can now produce more of both goods because its productive capacity has genuinely expanded.
IB Economics - Syllabus and Programme Full Guide →
The Four Assumptions of the PPC Model
Every economic model has assumptions - simplifications that make the model tractable, even if they don't reflect reality in perfect fashion. For the PPC, the four key assumptions are:
1. Fixed production possibilities: The model assumes the economy produces only two types of goods (producer goods and consumer goods). In reality, of course, modern economies produce millions of different products. But the two-good simplification is what makes the model visualisable.
2. Scarcity: The economy has a limited supply of resources at any given point in time. This is the whole reason the curve exists - unlimited resources would mean unlimited production, and there'd be no curve to draw.
3. Constant technology: Production techniques and technology are assumed to remain fixed throughout the analysis. This allows us to examine output trade-offs without technological change complicating the picture. In practice, technology evolves continuously - which is why PPC shifts are so important as a separate concept.
4. Efficiency: The model assumes that resources are fully and efficiently employed on the curve. Points on the PPC represent the best possible outcome given the constraints. This is why any point inside the curve tells us something has gone wrong - resources are being wasted.
IB Economics Summary
The PPC might seem confusing at first - two goods, a curve, a few points. But it captures something important about economic reality.
When the UK government faces difficult decisions about NHS funding versus infrastructure spending, that's a PPC problem. When Rwanda must choose between investing in manufacturing capacity or healthcare provision, that's a PPC problem. When the European Union debates how to allocate its budget between agricultural subsidies and green energy transition, that's a PPC problem.
And when you - personally - decide whether to spend your Sunday revising for IB Economics or doing literally anything else, that is also, technically, a PPC problem. (Your two goods are "exam preparedness" and "having a life." The curve no doubt is concave. There is no free lunch.)
The PPC is not really a simple diagram. It's a model of every decision made under scarcity - which is to say, every decision.
IB Economics Diagrams Programme, What's included:
200+ exam-ready diagrams covering the entire IB Economics syllabus
Video for every diagram showing you exactly how each model looks
Image version perfect for modelling diagrams in you essays, presentations, and your IA
Detailed written explanations of the IB Economics theory behind each diagram
Both SL and HL IB Economics diagrams clearly labelled and organised by topic
Real IB Economics exam application showing how to use diagrams effectively in Paper 1 and Paper 2
IB Economics Exam Tip: Drawing the PPC
When drawing a PPC in your IB Economics exam:
Label both axes (e.g. Capital Goods and Consumer Goods, or whatever the question specifies)
Draw a concave curve unless asked for constant opportunity cost
Label key points: at least one point on the curve, one inside (unemployment), one outside (unattainable)
Show opportunity cost by marking a movement along the curve with coordinates (G1→G2, S1→S2)
For shifts: use PPC1 and PPC2, and draw arrows indicating the direction of the shift
For non-parallel shifts: make sure only one end of the curve moves
Diagrams that are clear, labelled, and directly relevant to the argument you're making earn marks. A PPC crammed into a corner with tiny labels earns nothing.
Up next in this series: Scarcity and Opportunity Cost - the foundational ideas behind the PPC, explored in more detail. Check out the IB Economics Introduction to Economics for the full series.
Key PPC Diagrams
Frequently Asked Questions: Production Possibility Curve in IB Economics
Q1: What is the Production Possibility Curve (PPC) in IB Economics? The Production Possibility Curve (also called the PPF) shows the maximum combinations of two goods an economy can efficiently produce, given its current resources and technology. It illustrates the concepts of scarcity, choice, and opportunity cost - the three foundational ideas in economics. Every point on the curve represents full efficiency; points inside represent underperformance; points beyond the curve are currently unattainable.
Q2: What is the difference between a point inside and a point on the PPC? A point on the PPC means the economy is using all its resources efficiently - there is no unemployment of resources and production is at its maximum. A point inside the PPC indicates that some resources are unemployed or underused - the economy could produce more but isn't. This might be caused by a recession, a pandemic, or simply poor resource allocation. Moving from inside the curve to the curve is called actual growth.
Q3: Why is the PPC usually concave (curved), not a straight line? The PPC is concave to the origin because of increasing opportunity costs. Resources are not perfectly adaptable between uses - some workers and machines are better suited to producing certain goods than others. As you redirect more resources towards one type of production, you use increasingly unsuitable resources, meaning you sacrifice progressively more of the other good for each additional unit gained. A straight-line PPC assumes constant opportunity costs and perfect resource adaptability - a simplification that is less realistic.
Q4: What causes the PPC to shift outward in IB Economics? An outward shift of the PPC represents growth in production possibilities - an increase in the economy's productive capacity. Causes include: technological improvements that increase output from existing resources; growth in the labour force (e.g. population growth or immigration); investment increasing the capital stock; improvements in education and training that raise human capital quality; or discovery of new natural resources. South Korea's transformation from one of the world's poorest to one of its most advanced economies over 50 years is a classic example of sustained outward PPC shifts.
Q5: What is the difference between actual growth and potential growth on a PPC diagram? Actual growth is shown by movement from a point inside the PPC to a point on the curve - it represents the economy reducing unemployment and using its existing resources more fully. Potential growth (or growth in production possibilities) is shown by the entire PPC shifting outward - the economy's maximum productive capacity has genuinely expanded. An economy can experience actual growth without potential growth (e.g. recovering from a recession by reducing unemployment), or potential growth without actual growth (e.g. if new capacity is built but demand remains weak).
Related Topics:
IB Economics your IB Economics daily guide
IB Economics Introduction to Economics access here The PPC/PPF content as well as the rest of module 1
IB Economics Scarcity for expanding basic economics concepts, scarcity and choice
IB Economics Diagrams Check Unit 1 for All PPC / PPF diagrams with explanations
IB Economics Opportunity Cost for covering and revising opportunity cost theory
IB Economics Activity book Module 1 Introduction to Economics unit 1.3 for production possibilities PPC or PPF exam practice, activities, model answers and IB Economics Marking schemes
IB Economics 10 Strategies for Economic Growth "South Korea's economic transformation" → for expanding on economic growth and / or development understanding
IB Economics Paper 1 as The PPC/PPF and basic economics concepts may appear in these IB Economics exam papers
IB Economics Paper 2 as paper 2 may contain some PPC/PPF and basic economics concepts questions and exercises
IB economics Calculations Book make sure you check unit 1 Introduction to economics for The PPC/PPF and basic economics calculations exercises, IB model answers, and IB marking schemes
Read Next: IB Economics Introduction: The Circular Flow


© Theibtrainer.com 2012-2026. All rights reserved.
Legal
Have a Tip? Send us a tip using our anonymous form