
IB Business Toolkit Critical Path Analysis
Guide to the IB Business Toolkit - Learn Critical Path Analysis HL, master project management and how to schedule and resource business projects.
IB BUSINESS MANAGEMENTIB BUSINESS MANAGEMENT TOOLKITIB BUSINESS MANAGEMENT HL
Lawrence Robert
6/2/202610 min read
Critical Path Analysis (CPA): The Complete IB Business Management Guide
Target Question:
What is critical path analysis in IB Business Management?
Secondary Target Questions:
How do you calculate the earliest start time (EST) in a network diagram?
What is the difference between free float and total float in CPA?
What is a dummy activity in a CPA network diagram?
What are the limitations of critical path analysis as a business planning tool?
In 2012, Boeing's 787 Dreamliner was delayed by more than three years and cost billions in overruns. The main cause for this was the failure to properly sequence hundreds of interdependent tasks across dozens of global suppliers. The main use of Critical path analysis (CPA) is to prevent that kind of miscommunication - and it is a core HL tool in your IB Business Management toolkit.
This guide walks you through everything you need for the exam: how to read and complete a network diagram, how to calculate Earliest Start Times (ESTs) and Latest Finish Times (LFTs), how to identify the critical path, and how to calculate free float and total float. I have also included a full worked example and an exam-style practice exercise.
What is Critical Path Analysis?
IB Business Management Key definition Critical Path Analysis:
Critical path analysis (CPA) is a project management tool used to map all activities in a project against a timeline, identifying the sequence of tasks - the critical path - that determines the minimum time required to complete the project. Any delay to a task on the critical path will directly delay the entire project.
CPA is also known as network analysis or the critical path method (CPM). Before building a network diagram, a project manager must identify:
Every task (activity) required to complete the project
The duration of each task
The dependencies - tasks that cannot begin until a preceding task is finished
Tasks that can run concurrently (at the same time) to compress the timeline
Lawrence's Note:
The IB syllabus states that drawing a network diagram from scratch is not required. However, you must be able to complete a given diagram (fill in ESTs and LFTs), identify the critical path, and calculate free and total float. These skills can be tested.
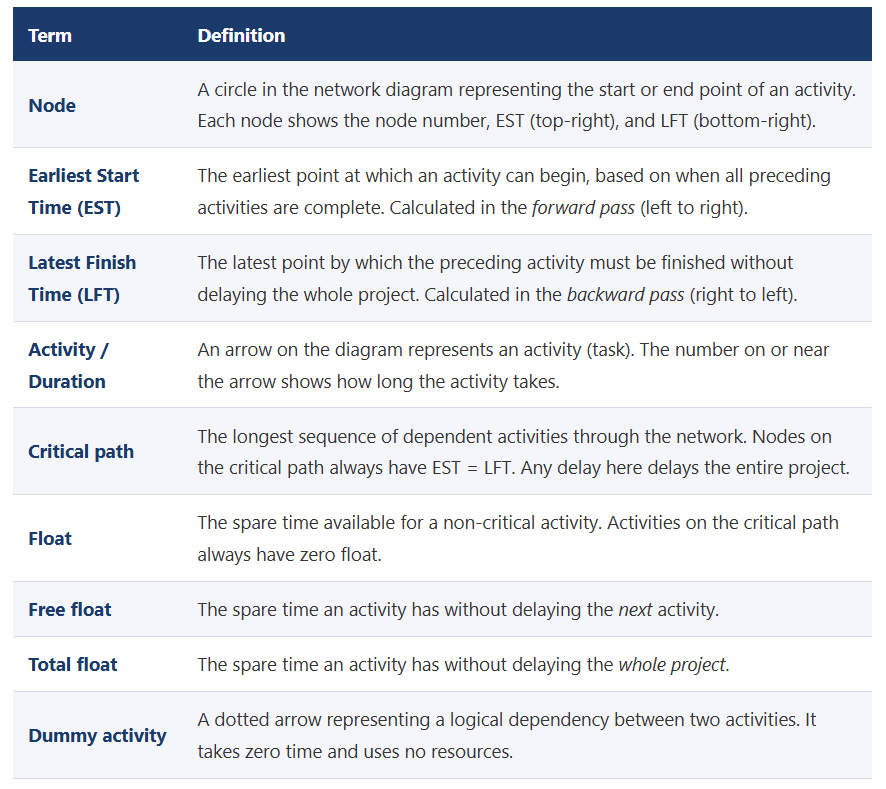
Key Terms
How to Read a Network Diagram
Every node in an IB Business Management network diagram is a circle divided into three sections:
Left semicircle: the node number (1, 2, 3…)
Top-right quarter: the Earliest Start Time (EST)
Bottom-right quarter: the Latest Finish Time (LFT)
An arrow represents an activity. The letter above identifies the activity (A, B, C…) and the number below shows its duration. Arrows always flow left to right.
Nodes on the critical path have identical EST and LFT values. Non-critical nodes have a gap between the two - that gap is the float available on that path.
Step 1 - The Forward Pass: Calculating ESTs
Forward Pass - Work Left to Right, Node by Node
Set the first node EST = 0 (the project starts at time zero).
Move right. For each node, add the duration of the incoming activity to the EST of the previous node.
If two or more activities feed into the same node, take the highest value. The node cannot be reached until all preceding activities are complete.
The EST of the final node is the minimum project duration.
Step 2 - The Backward Pass: Calculating LFTs
Backward Pass - Work Right to Left, Node by Node
Set the final node LFT = its EST (the project must finish on time).
Move left. For each node, subtract the duration of the outgoing activity from the LFT of the next node.
If two or more activities leave from the same node, take the lowest value. The node's LFT is constrained by whichever path is tightest.
Step 3 - Identifying the Critical Path
Once ESTs and LFTs are complete, identifying the critical path is straightforward:
Rule:
The critical path passes through every node where EST = LFT. Trace this sequence from Node 1 to the final node - that is the critical path. The activities linking those nodes are the critical activities.
Any node where EST ≠ LFT is not on the critical path - there is slack (float) on that branch. The difference between LFT and EST at that node tells you how much spare time exists.
Step 4 - Calculating Float
Float only applies to activities that are not on the critical path. There are two types:
Free float = EST of next node - EST of start node - Duration of activity
Total float = LFT of end node - Duration of activity - EST of start node
Free float tells you by how much you can delay an activity without affecting the next activity's earliest start time. Total float tells you by how much you can delay an activity without affecting the whole project. For activities on the critical path, both values are always zero.
Common Exam Error:
Students sometimes confuse the two formulas. The easiest way to remember: free float uses ESTs only (both the start node and the next node). Total float uses the LFT of the end node. When in doubt, write both formulas out before substituting values.
Dummy Activities
A dummy activity is shown as a dotted arrow in a network diagram. It is not a real task - it takes no time and uses no resources. Its sole purpose is to show a logical dependency that cannot otherwise be represented cleanly in the diagram structure.
For example: if Activity F depends on both Activity C and Activity E, but C and E feed from different nodes, a dummy activity is drawn from the end of one branch to the start of the other. This tells the reader that F cannot begin until both predecessors are complete, without creating a misleading merged arrow.
In the exam you may be asked to explain why a dummy activity has been included in a diagram. The answer will always relate to representing a dependency that crosses two separate paths in the network.
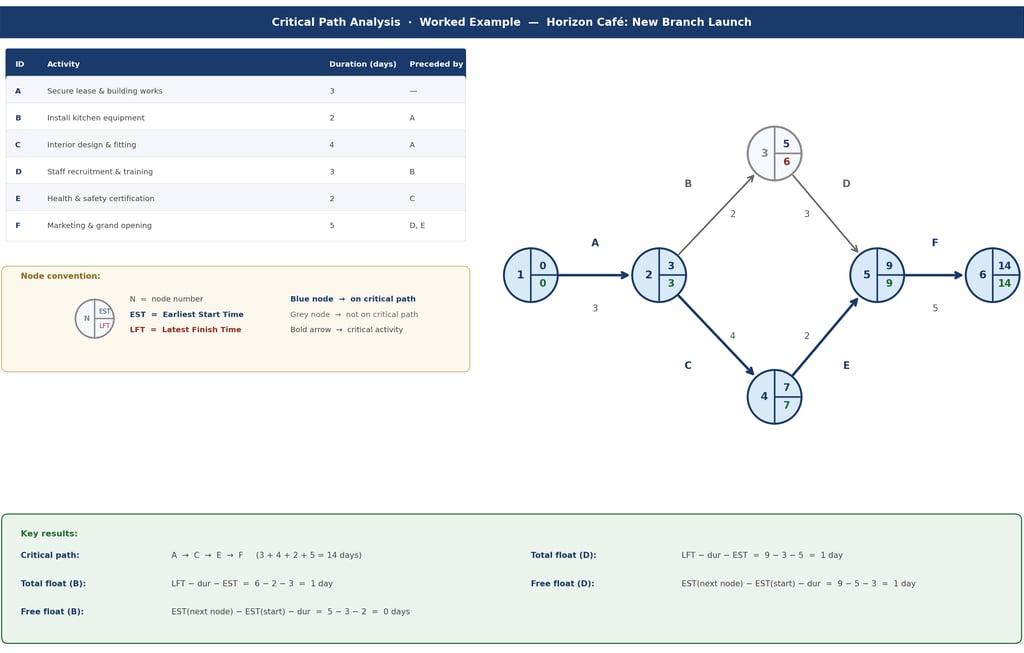
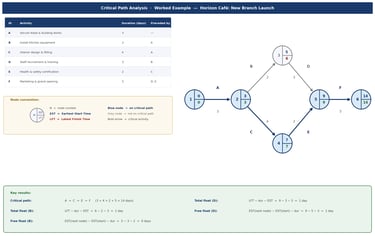
Worked Example - Horizon Café: New Branch Launch
Horizon Café is opening a new branch. The project manager has identified six activities. The network below shows the complete diagram with all ESTs and LFTs calculated, the critical path highlighted (bold arrows, blue nodes), and the float analysis for non-critical activities.
Figure 1: Completed network diagram for Horizon Café. Blue nodes and bold arrows mark the critical path (A → C → E → F = 14 days).
Step-by-step walkthrough
Forward pass (ESTs, left to right):
Node 1 = 0 (project start)
Node 2 = 0 + 3 (Activity A) = 3
Node 3 = 3 + 2 (Activity B) = 5
Node 4 = 3 + 4 (Activity C) = 7
Node 5 = max(5 + 3, 7 + 2) = max(8, 9) = 9 ← take the highest
Node 6 = 9 + 5 (Activity F) = 14 → minimum project duration = 14 days
Backward pass (LFTs, right to left):
Node 6 = 14 (LFT = EST for final node)
Node 5 = 14 − 5 = 9
Node 4 = 9 − 2 = 7
Node 3 = 9 − 3 = 6
Node 2 = min(6 − 2, 7 − 4) = min(4, 3) = 3 ← take the lowest
Node 1 = 3 − 3 = 0 ✓
Critical path: Nodes where EST = LFT are 1, 2, 4, 5, 6. The critical path is therefore A → C → E → F (total: 3 + 4 + 2 + 5 = 14 days).
Node 3 has EST = 5 and LFT = 6 — there is 1 day of float on the B–D branch.
Float calculations:
Total float (B): LFT − dur − EST = 6 − 2 − 3 = 1 day
Free float (B): EST(Node 3) − EST(Node 2) − dur = 5 − 3 − 2 = 0 days
Total float (D): LFT − dur − EST = 9 − 3 − 5 = 1 day
Free float (D): EST(Node 5) − EST(Node 3) − dur = 9 − 5 − 3 = 1 day
Notice that Activity B has zero free float but one day of total float. This means that if B is delayed at all, it immediately pushes back when Activity D can start - but the project can still finish on day 14, because D has one day of total float to absorb.
Advantages and Disadvantages of CPA
Advantages:
Identifies the minimum time needed to complete a project, helping managers set realistic deadlines.
Highlights which tasks are critical, so managers can prioritise resources and attention where delays would be most costly.
Float calculations show managers where there is scheduling flexibility, allowing resources to be redeployed from non-critical to critical tasks.
Supports better communication with stakeholders by providing a clear, visual project schedule.
Allows managers to model "what if" scenarios - for example, what happens if Activity B overruns by two days?
Disadvantages:
Duration estimates may be inaccurate - if actual task times differ, the entire diagram becomes unreliable.
The diagram can become extremely complex for large projects with many activities, making it difficult to read and manage.
Constructing and maintaining the diagram is time-consuming and requires specialist knowledge or software.
Does not account for the cost or quality of activities - a task completed quickly may be done poorly.
Can create a false sense of precision; the diagram looks rigorous but is still based on estimates and assumptions.
Lawrence's notes:
In a 4–6 mark evaluation question, always link your advantage or disadvantage to the specific context of the business in the question. For example: "Given that Horizon Café is opening its first new branch in a competitive market, any delay to the critical path - particularly the Health & Safety Certification (Activity E) - could push back the grand opening and allow a rival to capture market share first." Generic answers score fewer marks.
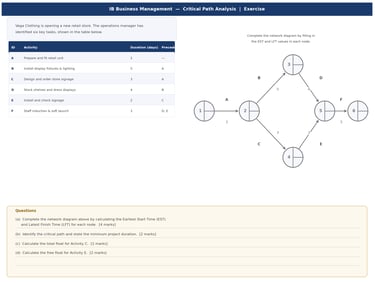
Exam Practice - Vega Clothing: New Store Launch
Vega Clothing is opening a new retail store. The network diagram below has been drawn for you - your task is to complete it by filling in the EST and LFT for every node, then answer the questions.
Figure 2: Blank network diagram for Vega Clothing. Fill in ESTs (top-right) and LFTs (bottom-right) in each node.
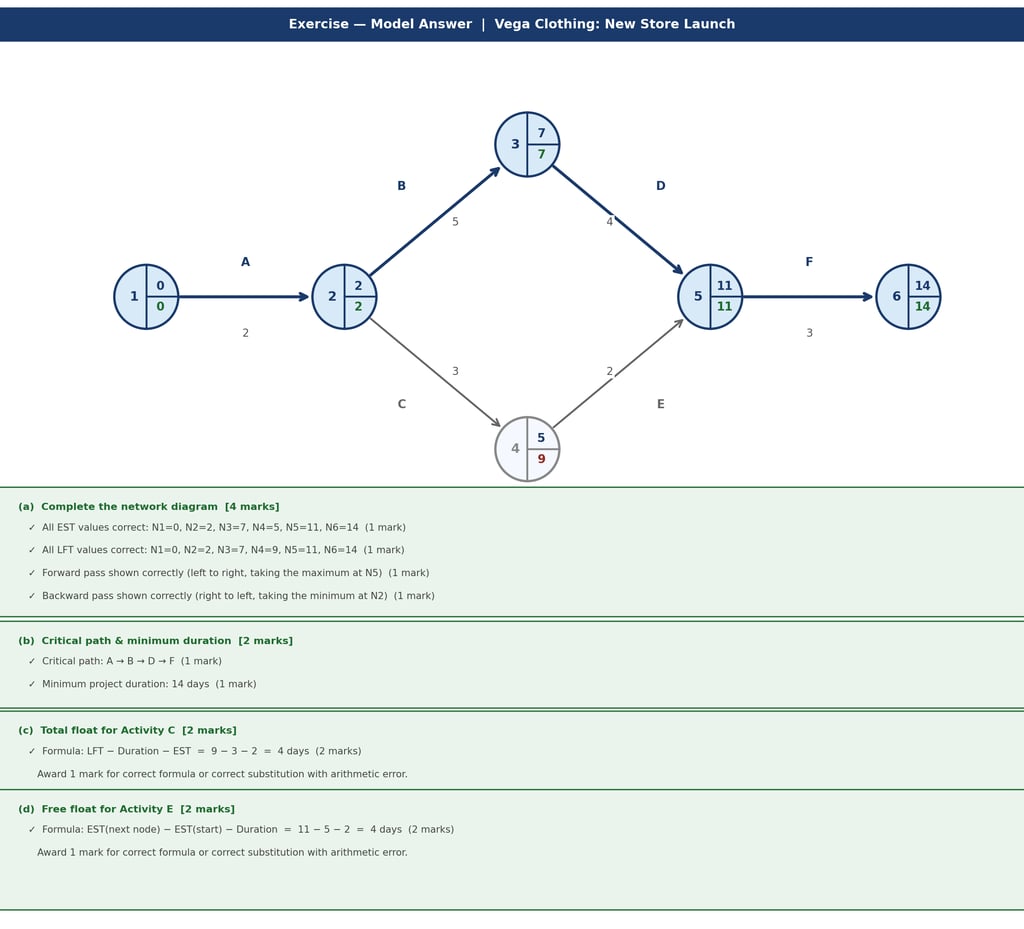
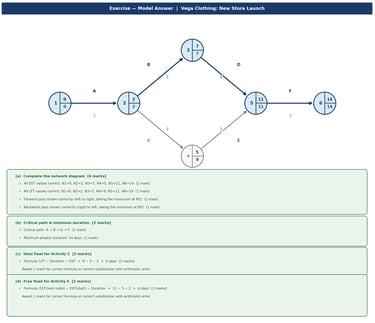
Model Answer
Figure 3: Completed network for Vega Clothing. Critical path: A → B → D → F (14 days). Mark scheme included.
Exam Technique - CPA Questions
Always show your forward pass first, then your backward pass. Marks are awarded for method, not just for the final answer.
At junctions with multiple incoming arrows, always take the highest EST value. Write both values down, cross out the lower one, and circle the higher one - examiners need to see your reasoning.
At junctions with multiple outgoing arrows (backward pass), always take the lowest LFT value. Same principle - show both, identify the minimum.
State the critical path as a sequence of activity letters (e.g. A → C → E → F), not just as node numbers. Verify that the total matches the minimum project duration in the final node.
For float questions, write the formula out in full, then substitute values. Award-winning answers look like: Total float = LFT − dur − EST = 9 − 3 − 2 = 4 days.
If EST = LFT everywhere, check your arithmetic - it likely means all activities are on the critical path, which can only happen in a purely linear network.
Frequently Asked Questions: Critical Path Analysis in IB Business Management
What is critical path analysis in IB Business Management?
Critical path analysis (CPA) is a project management tool assessed at HL in IB Business Management. It uses a network diagram to map all activities in a project against a timeline, calculating the earliest and latest each task can start or finish, and identifying the critical path - the sequence of tasks that determines the minimum time needed to complete the project. It is part of the Business Management Toolkit and assessed at AO2 and AO4.
How do you calculate the earliest start time (EST) in a network diagram?
ESTs are calculated in the forward pass, working from left to right through the diagram. Node 1 always has an EST of 0. For each subsequent node, add the duration of the incoming activity to the EST of the previous node. Where two or more activities feed into the same node, always take the highest value - because the project cannot reach that node until every preceding activity is complete.
What is the difference between free float and total float in CPA?
Both measure spare time on non-critical activities, but they measure it differently. Free float (= EST of next node − EST of start node − duration) is the spare time an activity has without delaying the next activity in the sequence. Total float (= LFT of end node − duration − EST of start node) is the spare time without delaying the whole project. An activity can have zero free float but positive total float - meaning any delay immediately pushes back the next task, but the project overall still finishes on time.
What is a dummy activity in a CPA network diagram?
A dummy activity is a dotted arrow in a network diagram that represents a logical dependency rather than a real task. It takes zero time and consumes no resources. Dummy activities are used when an activity depends on two predecessors that come from different nodes in the diagram - the dummy arrow connects those nodes to show that both must be complete before the next activity can begin.
What are the limitations of critical path analysis as a business planning tool?
CPA is only as reliable as the time estimates used to build it. If any duration proves inaccurate, the entire diagram must be redrawn. For complex projects, the diagram can become very difficult to interpret. CPA also focuses purely on time - it does not capture the cost, quality, or resource requirements of individual activities. Finally, it can create a false sense of control: a project that looks well-planned on paper can still fail if external factors (supplier delays, staff absence, regulatory changes) are not anticipated.
Explore IB Business Management And Critical Path Analysis
IB Business Management Main Hub your daily IB Business Management resource
IB Business Management Critical Path Analysis in the Business Management Toolkit
IB Business Management Paper 1 Exam Review Hub find Critical Path Analysis exam questions in Paper 1
IB Business Management Paper 2 Exam Review Hub study Critical Path Analysis exam questions in Paper 2
IB Business Management Paper 3 Exam Review Hub explore Critical Path Analysis exam questions in Paper 3
IB Business Management Activity Book: Explore and practice The Business Management Toolkit including Critical Path Analysis, Unit 1 Swot Analysis, Unit 2 Ansoff Matrix, Unit 3 Steeple Analysis, Unit 4 Boston Consulting Group (BCG) Matrix, Unit 5 Business Plan, Unit 6 Decision Trees, Unit 7 Descriptive Statistics, Unit 8 Circular Business Models, Unit 9 Gantt Charts (HL only), Unit 10 Porter’s Generic Strategies (HL only), Unit 11 Hofstede’s cultural dimensions (HL only), Unit 12 Force Field Analysis (HL only), Unit 13 Critical Path Analysis (HL only), Unit 14 Contribution (HL only), Unit 15 Simple Linear Regression (HL only) activities, exam questions, case studies, IB Standard model answers and IB marking schemes.
Read Next: IB Business Management Toolkit Contribution HL


© Theibtrainer.com 2012-2026. All rights reserved.
Legal
Have a Tip? Send us a tip using our anonymous form