
IB Business Toolkit Decision Trees
Guide to the IB Business Toolkit. Learn about Decision Trees - A quantitative tool used for visualising options and outcomes. For IB Business students.
IB BUSINESS MANAGEMENTIB BUSINESS MANAGEMENT SLIB BUSINESS MANAGEMENT HL
Lawrence Robert
5/26/20265 min read
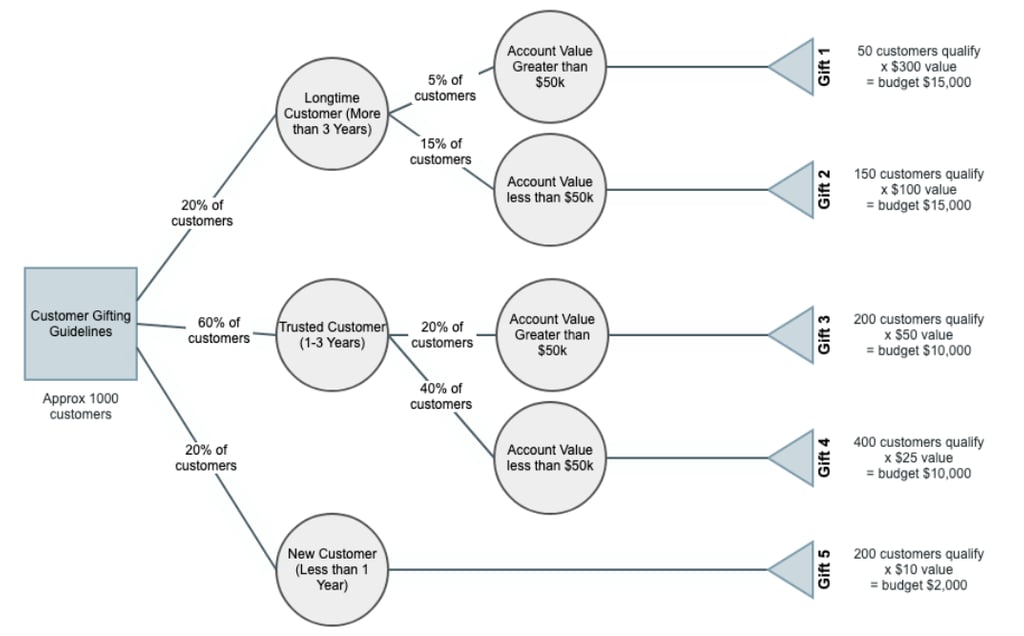
Toolkit 6: Decision Trees
Target question:
What is a Decision tree in IB Business Management?
Decision trees provide graphical representation of sequential uncertain decisions, allowing us to evaluate alternative choices by calculating their expected values through probabilities and financial outcomes. This quantitative analytical tool enables systematic evaluation of complex decisions involving multiple stages, uncertain outcomes, and sequential choices dependent on prior results. Decision trees bring rigour and transparency to strategic decision-making by underlying choices through documenting assumptions, probabilities, and payoffs.
Decision Tree Components:
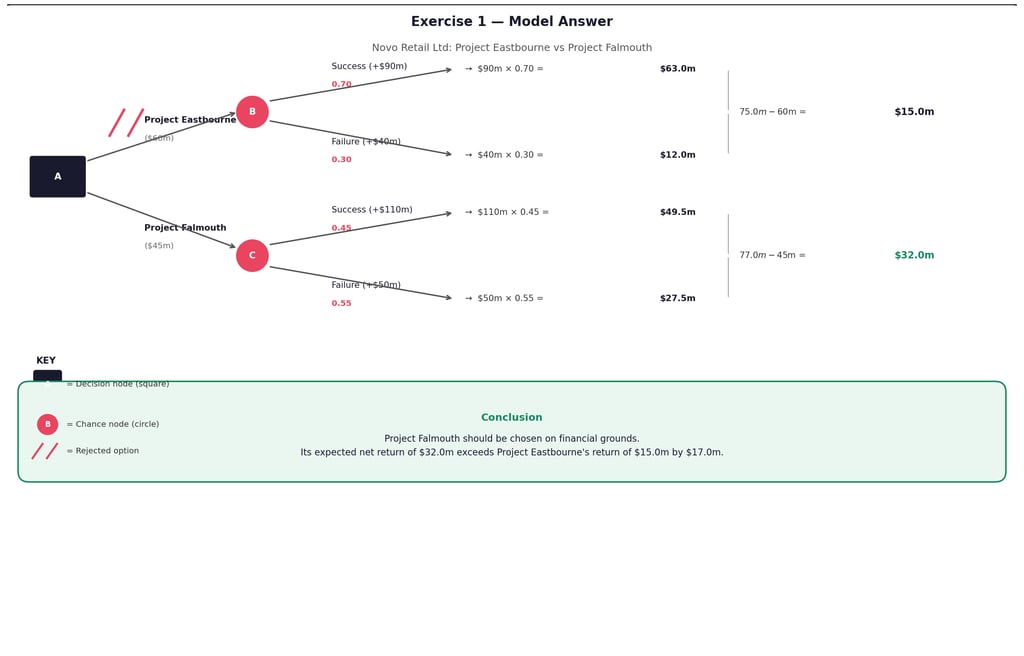
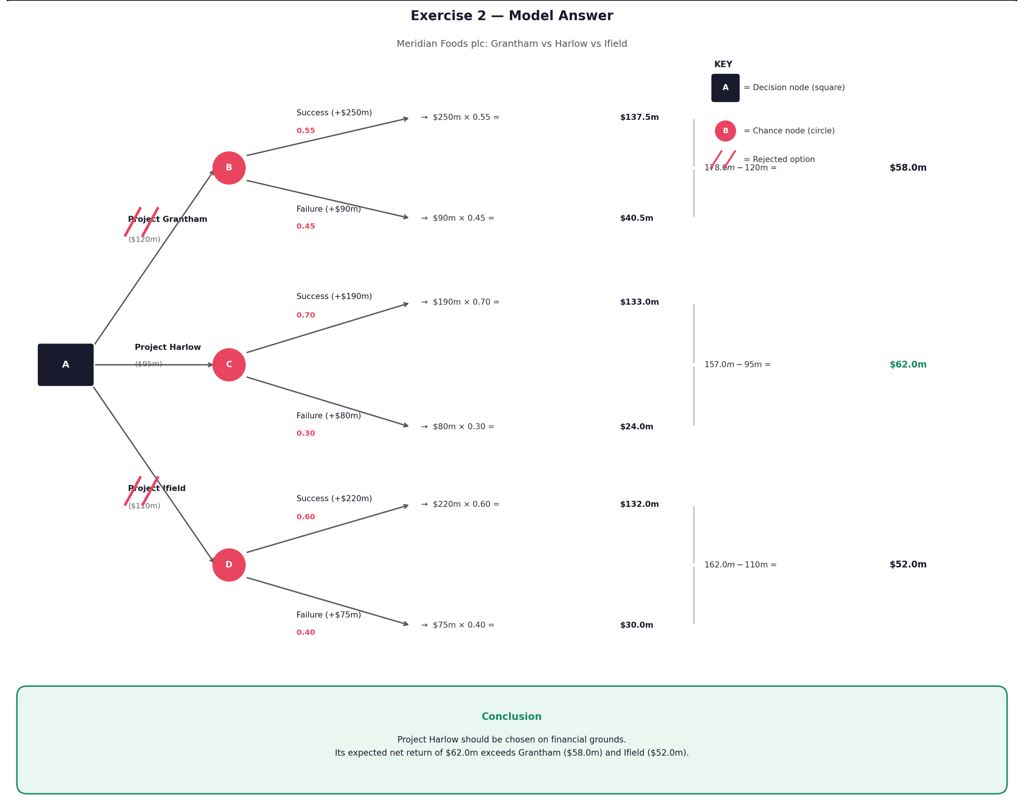
Decision Nodes (Squares) - Points where decision-makers choose between alternative actions. Each branch extending from decision nodes represents possible choices under consideration. Decisions typically involve actions like "launch product," "expand market," "invest in technology," or "maintain status quo."
Chance Nodes (Circles) - Points where outcomes depend on uncertain events beyond decision-maker control. Branches from chance nodes represent possible scenarios with associated probabilities. Common uncertainties include customer acceptance, competitor responses, economic conditions, or regulatory changes.
Terminal Nodes (Endpoints) - Final outcomes showing financial consequences (payoffs) resulting from decision sequences and chance outcomes. Payoffs typically represent net present value, profit, or other financial metrics enabling comparison across different alternatives.
Probabilities - Numerical estimates (summing to 1.0 for each chance node) indicating likelihood of different uncertain outcomes occurring. Probability estimation requires judgment, historical data analysis, or expert opinion.
Payoffs - Financial outcomes associated with each endpoint, typically representing revenues minus costs considering time value of money through discounting terms where appropriate.
Calculating Expected Monetary Values (EMV)
Decision tree analysis works backwards from terminal nodes to initial decision:
Expected Value Calculation - For each chance node, multiply payoff by probability for each branch, then add the results: EMV = (Probability₁ × Payoff₁) + (Probability₂ × Payoff₂) + ... + (Probabilityₙ × Payoffₙ)
Working Backwards - Calculate expected values for all chance nodes, then compare alternatives at decision nodes selecting the highest expected value option. Process continues backward through tree until reaching the initial decision.
Worked Example for you: Technology start-up deciding whether to develop new mobile app:
Develop app costs $500,000
If successful (60% probability): generates $1,500,000 profit
If unsuccessful (40% probability): generates $200,000 profit
Alternative: maintain current product generating certain $400,000 profit
Develop app branch: EMV = (0.60 × $1,500,000) + (0.40 × $200,000) - $500,000 EMV = $900,000 + $80,000 - $500,000 = $480,000
Maintain current product: EMV = $400,000
Optimal decision: Develop app (EMV $480,000 > $400,000)
Decision Trees Strategic Application
Decision trees apply across business contexts:
Capital Investment Decisions - Evaluating major investments in facilities, equipment, or technology projects with uncertain returns. Decision trees model different investment scales, timing alternatives, and outcome results.
Market Entry Strategies - Assessing international expansion or new market entry decisions considering uncertain demand, competitive response, and regulatory environments. Sequential decisions model staged commitment strategies.
Product Launch Decisions - Evaluating new product development considering development costs, uncertain market acceptance, and potential product extensions or product abandonment decisions.
Merger and Acquisition Analysis - Assessing acquisition targets under uncertain integration success, synergy compatibility, and market reactions.
Limitations and Considerations
Decision trees face important constraints:
Probability Estimation Challenges - Accurate probability estimates prove difficult, particularly for new situations lacking historical data. Subjective probabilities introduce uncertainty into analysis potentially misleading decisions.
Oversimplification - Trees simplify complex reality limiting scenarios and the number of outcomes modelled. Important factors may be omitted or quantified inaccurately.
Risk Attitudes Ignored - Expected value analysis assumes risk is neutral where decision-makers may be indifferent between a certain outcome and a higher-risk gamble with an equivalent expected value. Reality is different as it involves risk aversion or risk-seeking behaviours not captured by pure expected value calculations.
Static Analysis - Trees represent single-point-in-time analysis but decisions often involve flexibility as there is a need to adapt as uncertainties take time to unveil. Real options analysis addresses this limitation.
Modern Decision Tree Applications:
Monte Carlo simulation generating thousands of scenarios testing probability assumption sensitivity
Integration with sensitivity analysis identifying which variables most impact decisions
Machine learning algorithms estimating probabilities from large datasets
Real-time dashboards enabling dynamic decision tree updating as new information emerges
Examples Decision Trees
Technology start-up deciding whether to develop new mobile app or not:
Develop app costs $500,000 If successful (60% probability): generates $1,500,000 profit If unsuccessful (40% probability): generates $200,000 profit
Alternative: maintain current product generating certain $400,000 profit
Develop app branch: EMV = (0.60 × $1,500,000) + (0.40 × $200,000) - $500,000
EMV = $900,000 + $80,000 - $500,000 = $480,000
Maintain current product: EMV = $400,000
Optimal decision: Develop app (EMV $480,000 > $400,000)
Find Support For Practicing Decision Trees
The IB Business Management Activity and Case Study Book includes a full Module 6 section with case studies across all 15 tools - Swot Analysis, Ansoff Matrix, Steeple Analysis, Boston Consulting Group (BCG) Matrix, Business Plan, Decision Trees, Descriptive Statistics, Circular Business Models, Gantt Charts (HL only), Porter’s Generic Strategies (HL only), Hofstede’s cultural dimensions (HL only), Force Field Analysis (HL only), Critical Path Analysis (HL only), Contribution (HL only), Simple Linear Regression (HL only) (All with worked exam responses and marking schemes aligned to every assessment objective.)
Explore IB Business Management And Swot Analysis
IB Business Management Main Hub your daily IB Business Management resource
IB Business Management Decision Trees in the Business Management Toolkit
IB Business Management Paper 1 Exam Review Hub find Decision trees exam questions in Paper 1
IB Business Management Paper 2 Exam Review Hub study Decision trees exam questions in Paper 2
IB Business Management Paper 3 Exam Review Hub explore Decision trees exam questions in Paper 3
IB Business Management Activity Book: Explore and practice The Business Management Toolkit including Decision trees, Unit 1 Swot Analysis, Unit 2 Ansoff Matrix, Unit 3 Steeple Analysis, Unit 4 Boston Consulting Group (BCG) Matrix, Unit 5 Business Plan, Unit 6 Decision Trees, Unit 7 Descriptive Statistics, Unit 8 Circular Business Models, Unit 9 Gantt Charts (HL only), Unit 10 Porter’s Generic Strategies (HL only), Unit 11 Hofstede’s cultural dimensions (HL only), Unit 12 Force Field Analysis (HL only), Unit 13 Critical Path Analysis (HL only), Unit 14 Contribution (HL only), Unit 15 Simple Linear Regression (HL only) activities, exam questions, case studies, IB Standard model answers and IB marking schemes.
Read Next: IB Business Management Toolkit Gantt Chart
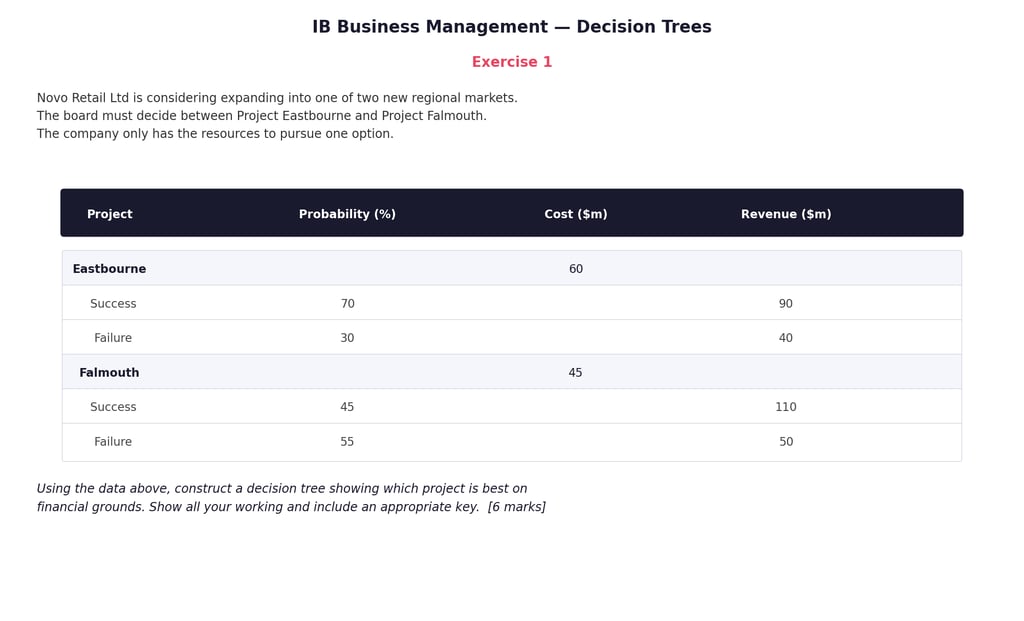
© Theibtrainer.com 2012-2026. All rights reserved.
Legal
Have a Tip? Send us a tip using our anonymous form