IB Business Toolkit HL Gantt Charts
Guide to the IB Business Toolkit. Learn about HL only Gantt Charts - Visual sequencing, planning & scheduling for your projects. For IB Business students.
IB BUSINESS MANAGEMENTIB BUSINESS MANAGEMENT HLIB BUSINESS MANAGEMENT TOOLKIT
Lawrence Robert
5/28/20264 min read
Toolkit 9: Gantt Charts (HL Only)
Target question:
What is a Gantt chart in IB Business Management?
Project Planning and Scheduling Tool
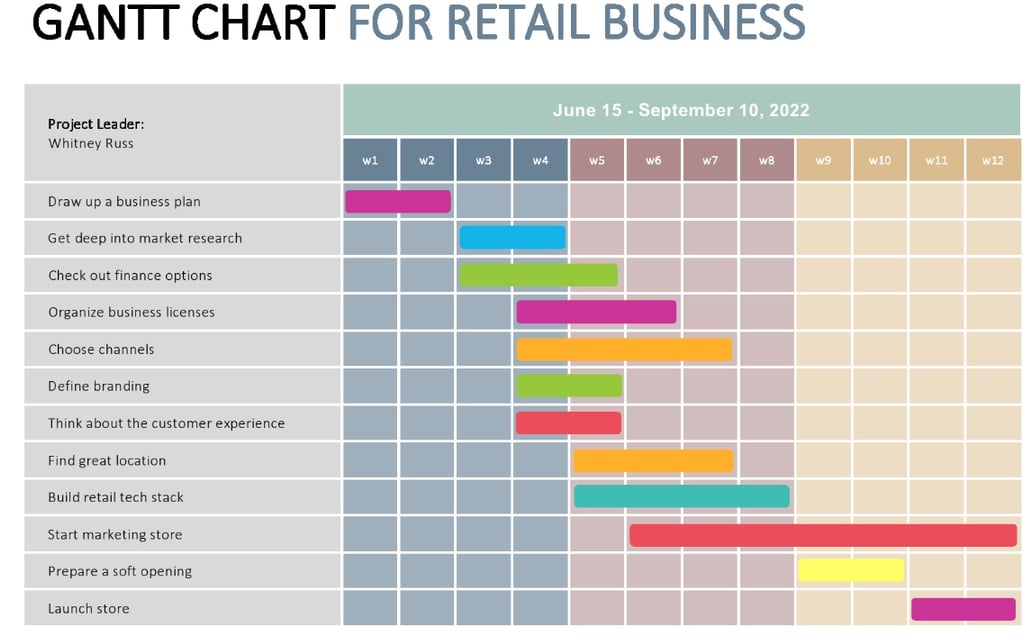
A Gantt chart is a visual project management tool that maps tasks against a timeline. Each horizontal bar represents one task - its position shows when the task starts and ends, and its length shows how long it takes.
Named after American engineer Henry L. Gantt (1861–1919), Gantt charts are used across business, construction, engineering, and event management to plan, schedule, and monitor projects from start to finish.
In IB Business Management, Gantt charts sit within Operations Management and are assessed at Higher Level only. You are expected to construct them from data, interpret them, and evaluate their usefulness as a planning tool.
In general, Gantt charts provide a visual representation of project schedules showing tasks, durations, dependencies, and timelines enabling project managers to plan, coordinate, and track complex projects that involve multiple activities and resources.
Henry Gantt developed this bar chart technique in the 1910s primarily for scientific management applications, creating a successful project management tool that now is provided by leading software such as Microsoft Project, Asana, and Monday.com. Gantt charts transform abstract project plans into concrete schedules by clarifying task sequences, resource requirements, and critical milestones.
Ultimately, a Gantt chart helps project managers determine how long a project should take to complete with the available resources. It helps managers to set realistic deadlines for the various activities of a project.
Gantt Chart Components:
Task (Activity)
A single unit of work within the project (e.g. "Design logo", "Order materials").
Duration
How long a task takes to complete, usually measured in days or weeks.
Start date
The earliest point at which a task can begin.
Dependency
A task that cannot begin until another task has been completed first.
Concurrent tasks
Tasks that can be carried out at the same time as one another.
Milestone
A significant checkpoint or deadline in the project (often shown as a diamond ◆).
Critical path
The sequence of dependent tasks that determines the minimum project duration.
Dependency Types:
Finish-to-Start (FS) - Most common relationship where Task B cannot start until Task A finishes. Example: construction cannot begin until permits approved.
Start-to-Start (SS) - Task B cannot start until Task A starts, but both may happen at the same time. Example: quality testing begins when production starts, continuing in parallel.
Finish-to-Finish (FF) - Task B cannot finish until Task A finishes. Example: documentation completion waits for software development completion.
Start-to-Finish (SF) - Rare relationship where Task B cannot finish until Task A starts. Example: night shift coverage continues until day shift arrives.
Advantages and Disadvantages Gantt Charts
Advantages
Shows task dependencies clearly, helping managers sequence work efficiently.
Simple to read - managers and team members can identify progress at a glance.
Helps set realistic deadlines by breaking a project into manageable tasks.
Flexible - used for production scheduling, staff rotas, and new product launches.
Allows managers to spot delays early and take corrective action.
Disadvantages
Bar length shows time, not effort - a short bar may involve more work than a long one.
Must be updated regularly or it becomes misleading.
Complex projects with many tasks may not fit on a single page.
Relies on time estimates, which may prove inaccurate.
Does not show the cost or resource requirements attached to each task.
IB Business Management Lawrence's tip:
When evaluating Gantt charts in an exam, always link your advantage or disadvantage to the specific business context in the question. A generic answer scores fewer marks than one that refers to the firm, industry, or situation provided.
Strategic Application:
When Initiating Projects - Gantt charts translate the project scope into doable schedules. Breaking down complex initiatives into manageable tasks and when applying realistic timing estimations, it enables efficient resource planning and quick stakeholder communication on the different timelines.
Resource Allocation - The visual representation of resource conflicts when multiple tasks require the same resources simultaneously. Resource levelling redistributes work avoiding possible overallocation of resources.
Communication - Gantt charts provide easy and quick understanding for stakeholders about project status, upcoming activities, and timeline expectations. The visual format is accessible to non-technical audiences.
Progress Monitoring - Regular updates contrasting the actual progress with the planned schedule help identify delays that require modifications. The critical path visibility displays primarily those activities most affecting project completion.
Risk Management - Identifying task dependencies reveals possible project vulnerabilities particularly when delays affect multiple activities. Buffer time allocation mitigates the risks and possible delays on critical activities.
Example company & Gantt Chart
Researched example: Ecosip
Find Support For Practicing Gantt Charts
The IB Business Management Activity and Case Study Book includes a full Module 6 section with case studies across all 15 tools - Swot Analysis, Ansoff Matrix, Steeple Analysis, Boston Consulting Group (BCG) Matrix, Business Plan, Decision Trees, Descriptive Statistics, Circular Business Models, Gantt Charts (HL only), Porter’s Generic Strategies (HL only), Hofstede’s cultural dimensions (HL only), Force Field Analysis (HL only), Critical Path Analysis (HL only), Contribution (HL only), Simple Linear Regression (HL only) (All with worked exam responses and marking schemes aligned to every assessment objective.)
Explore IB Business Management And Gantt Charts
IB Business Management Main Hub your daily IB Business Management resource
IB Business Management Gantt Charts in the Business Management Toolkit
IB Business Management Paper 1 Exam Review Hub find Gantt Charts exam questions in Paper 1
IB Business Management Paper 2 Exam Review Hub study Gantt Charts exam questions in Paper 2
IB Business Management Paper 3 Exam Review Hub explore Gantt Charts exam questions in Paper 3
IB Business Management Activity Book: Explore and practice The Business Management Toolkit including Gantt Charts, Unit 1 Swot Analysis, Unit 2 Ansoff Matrix, Unit 3 Steeple Analysis, Unit 4 Boston Consulting Group (BCG) Matrix, Unit 5 Business Plan, Unit 6 Decision Trees, Unit 7 Descriptive Statistics, Unit 8 Circular Business Models, Unit 9 Gantt Charts (HL only), Unit 10 Porter’s Generic Strategies (HL only), Unit 11 Hofstede’s cultural dimensions (HL only), Unit 12 Force Field Analysis (HL only), Unit 13 Critical Path Analysis (HL only), Unit 14 Contribution (HL only), Unit 15 Simple Linear Regression (HL only) activities, exam questions, case studies, IB Standard model answers and IB marking schemes.
Read Next: IB Business Management Toolkit Porter's Generic Strategies
© Theibtrainer.com 2012-2026. All rights reserved.
Legal
Have a Tip? Send us a tip using our anonymous form