
IB Business Toolkit Simple Linear Regression
Guide to the IB Business Toolkit - Learn Simple Linear Regression HL and analyse the relationship between a business' independent & dependent variables
IB BUSINESS MANAGEMENTIB BUSINESS MANAGEMENT TOOLKITIB BUSINESS MANAGEMENT HL
Lawrence Robert
6/3/20269 min read
Simple Linear Regression: The Complete IB Business Management HL Guide
Target Question:
What is simple linear regression in IB Business Management?
In 2022, Netflix lost 200,000 subscribers in a single quarter - and its share price fell 35% in a day. The warning signs had been visible for months: scatter diagrams tracking subscriber growth against password-sharing rates and competition entry showed quite clearly that the correlation was weakening. Simple linear regression, at its core, is the tool that answers the business question every manager faces: if this variable changes, what happens to that one? And - what might the future look like if the current trend continues?
This guide covers the final tool in the IB Business Management Toolkit: simple linear regression HL. You will learn how to read and interpret scatter diagrams, draw and use a line of best fit, describe and evaluate correlation, and apply extrapolation to make business predictions.
What is Simple Linear Regression?
IB Business Management - Key Definition:
Simple linear regression is a statistical tool used to investigate and quantify the relationship between an independent variable (the variable managers choose or control) and a dependent variable (the outcome being measured). A straight line - the line of best fit - is drawn through the data to show the strength and direction of this relationship, and to enable predictions about future values.
In business, common applications include:
Advertising spend (independent) vs. sales revenue (dependent)
Staff training hours (independent) vs. labour productivity (dependent)
Price reductions (independent) vs. demand increases (dependent)
Customer service investment (independent) vs. customer retention rate (dependent)
There are three key components: the scatter diagram, the line of best fit, and correlation and extrapolation.
Scatter Diagrams
IB Business Management - Key Definition:
A scatter diagram (or scatter chart) is a graphical representation of the relationship between two quantifiable variables. Each data point represents one observation - its horizontal position shows the value of the independent variable (x-axis), and its vertical position shows the value of the dependent variable (y-axis).
Scatter diagrams are used to visualise whether a relationship exists between the two variables before drawing a line of best fit. They can also reveal outliers - data points that lie far outside the overall pattern, which may indicate extreme values or errors in data collection. Outliers can distort the line of best fit and weaken apparent correlations.
Types of Correlation
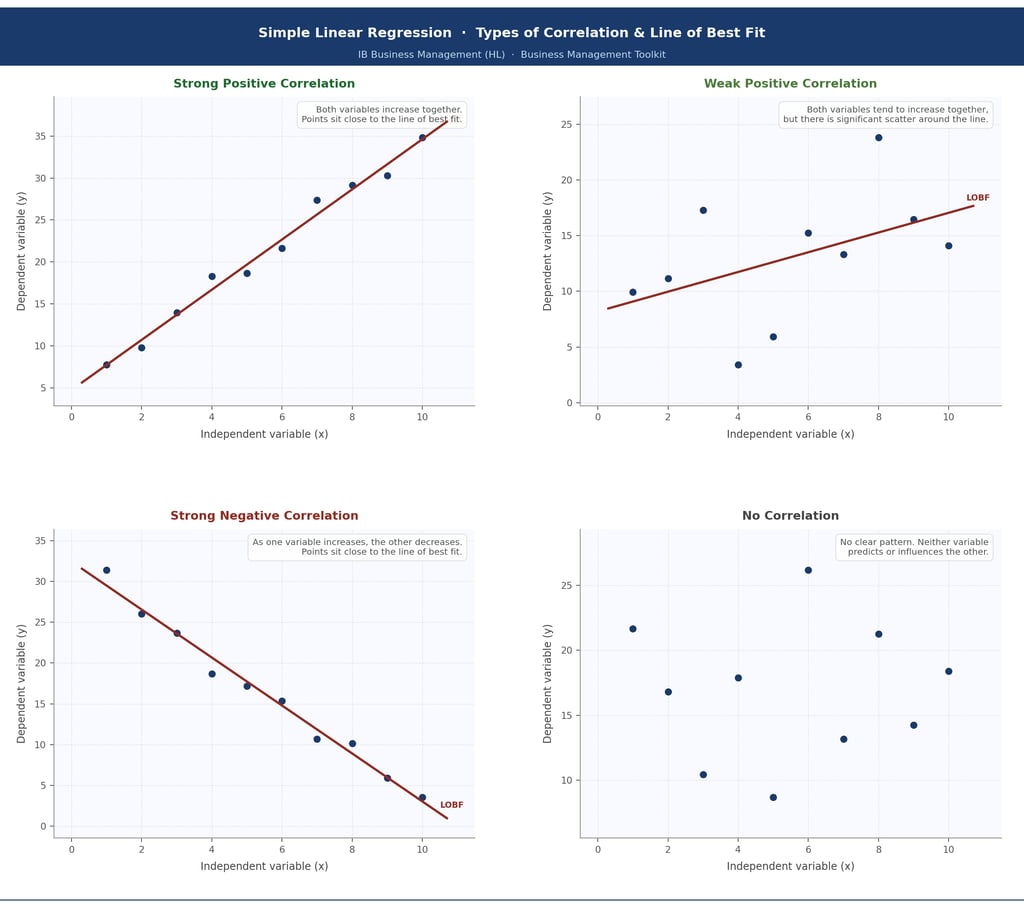
The diagram below shows all four possible correlation types that can appear in an IB Business Management scatter diagram question.
Figure 1: The four types of correlation. Strong correlations show data points close to the line of best fit; weak correlations show more scatter. The direction (positive or negative) shows whether the variables move together or in opposite directions.
Describing Correlation: Two Dimensions
Any correlation in a scatter diagram has two characteristics that you may be asked to describe in the IB Business Management exam:
1 - Direction
Positive: as x increases, y also increases. The line of best fit slopes upward.
Negative: as x increases, y decreases. The line of best fit slopes downward.
No correlation: no discernible pattern - the line of best fit would be near-horizontal.
2 - Strength
Strong: data points cluster tightly around the line of best fit. High predictive power.
Weak: data points are widely scattered around the line. Low predictive power.
Strength is determined by how closely the points follow the line - not by the steepness of the slope.
Lawrence's Notes: Exam Technique
When asked to "describe the correlation", always give both the direction (positive/negative/none) and the strength (strong/weak). For example: "There is a strong positive correlation between staff training days and customer satisfaction - as training increases, satisfaction increases, and data points lie close to the line of best fit." A one-word answer scores only partial marks.
Line of Best Fit (LOBF)
IB Business Management - Key Definition:
The line of best fit is a straight line drawn through a scatter diagram that best represents the overall trend in the data. It is positioned so that approximately half the data points fall above it and half fall below. The line minimises the total squared distance between itself and all data points (least squares method).
In IB Business Management, you are expected to be able to:
Draw the line of best fit by eye - through the midpoint of the data, with roughly equal points above and below
Use the line to read off predicted values for given x-values
Extend the line (extrapolate) beyond the observed data range to make predictions
Drawing the LOBF - Key Rules:
The line must be straight, must pass through the main cluster of data, and must have roughly equal numbers of points on each side. It does not need to pass through any specific data point. A single outlier should not pull the line significantly off-course - assess the general trend and ignore extreme outliers when drawing the line.
Correlation and Causation
Critical Warning - Correlation ≠ Causation
A correlation in a scatter diagram does not prove that one variable causes the other. There may be a third variable (a confounding factor) that drives both. For example: a firm may find a strong positive correlation between staff training hours and productivity - but the real driver might be increased staff motivation, which both encourages staff to seek training and to work harder. Always acknowledge this limitation when evaluating scatter diagram findings.
Extrapolation
IB Business Management - Key Definition:
Extrapolation is a statistical technique that extends the line of best fit beyond the range of observed data in order to make predictions about future or unknown values. It assumes that the linear relationship identified in the historical data will continue into the future.
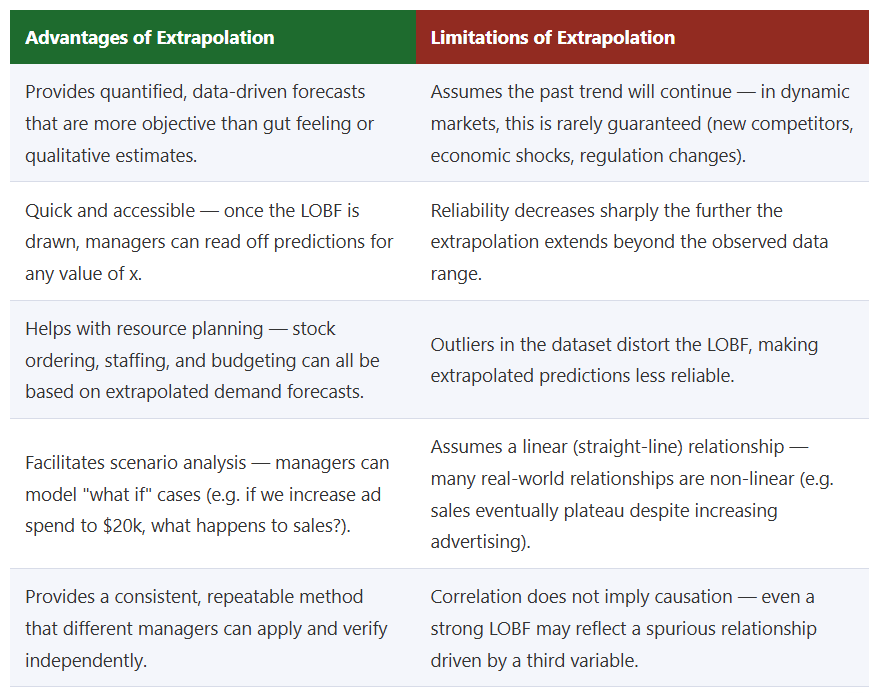
Extrapolation is a powerful forecasting tool, but it comes with significant assumptions and risks:
Worked Example - Solaris Café
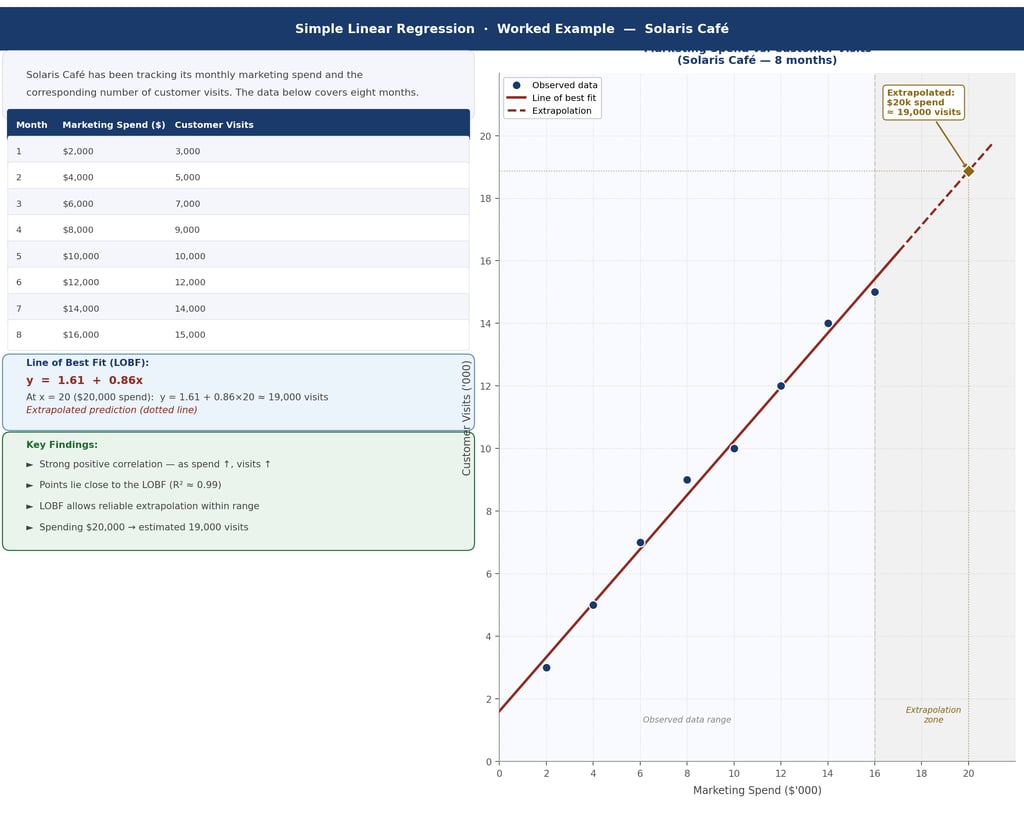
Solaris Café has been tracking its monthly marketing spend and customer visits over eight months. The scatter diagram below shows the data, the line of best fit, and an extrapolated prediction for if spend reaches $20,000 per month.
Figure 2: Solaris Café scatter diagram. A strong positive correlation is visible; data points sit close to the LOBF. The extrapolation zone (shaded amber) shows the prediction beyond the observed data range.
Reading the Worked Example
The data shows a strong positive correlation - as marketing spend increases, customer visits increase proportionally.
The line of best fit has the equation y = 1.61 + 0.86x, meaning each additional $1,000 in marketing spend is associated with approximately 860 additional customer visits.
The extrapolated prediction at $20,000 spend is approximately 19,000 visits - useful for capacity planning.
The shaded zone beyond x = 16 marks the extrapolation region - predictions here carry greater uncertainty, as Solaris Café has no actual data in this range.
The R² value is very high (≈0.99), indicating that marketing spend explains almost all the observed variation in customer visits in this dataset.
Evaluating This Extrapolation
While the prediction looks reliable within the observed range, Solaris Café should spend beyond $16,000 with caution. Diminishing returns may apply - after a certain point, more advertising reaches fewer new customers. External factors (competitor openings, seasonal demand) could also break the linear pattern. The extrapolation is a useful starting point, but it does not provide guarantees.
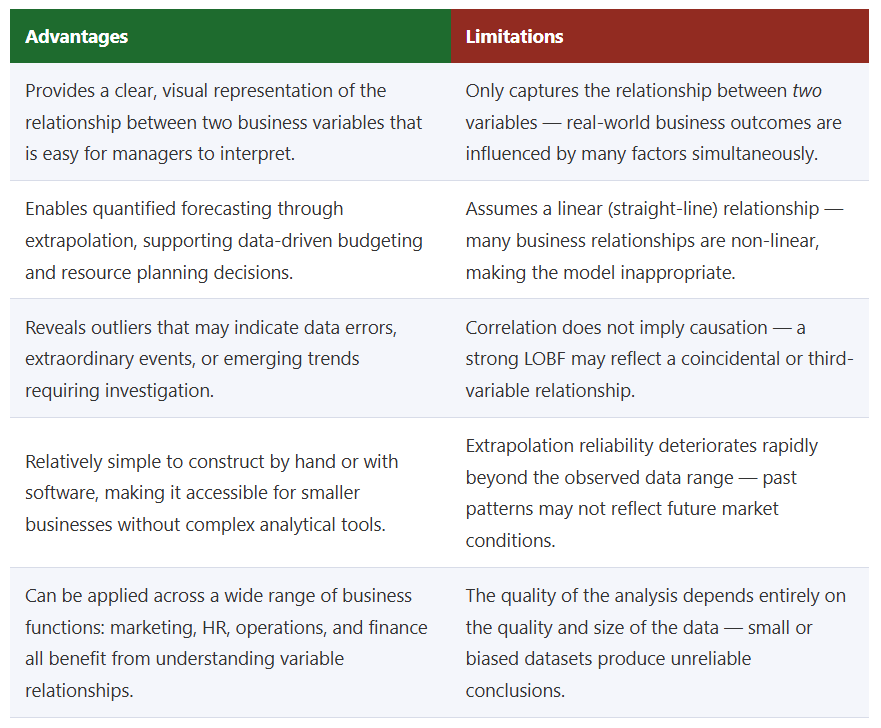
Advantages and Limitations of Simple Linear Regression
Exam Practice - Nexus Solutions
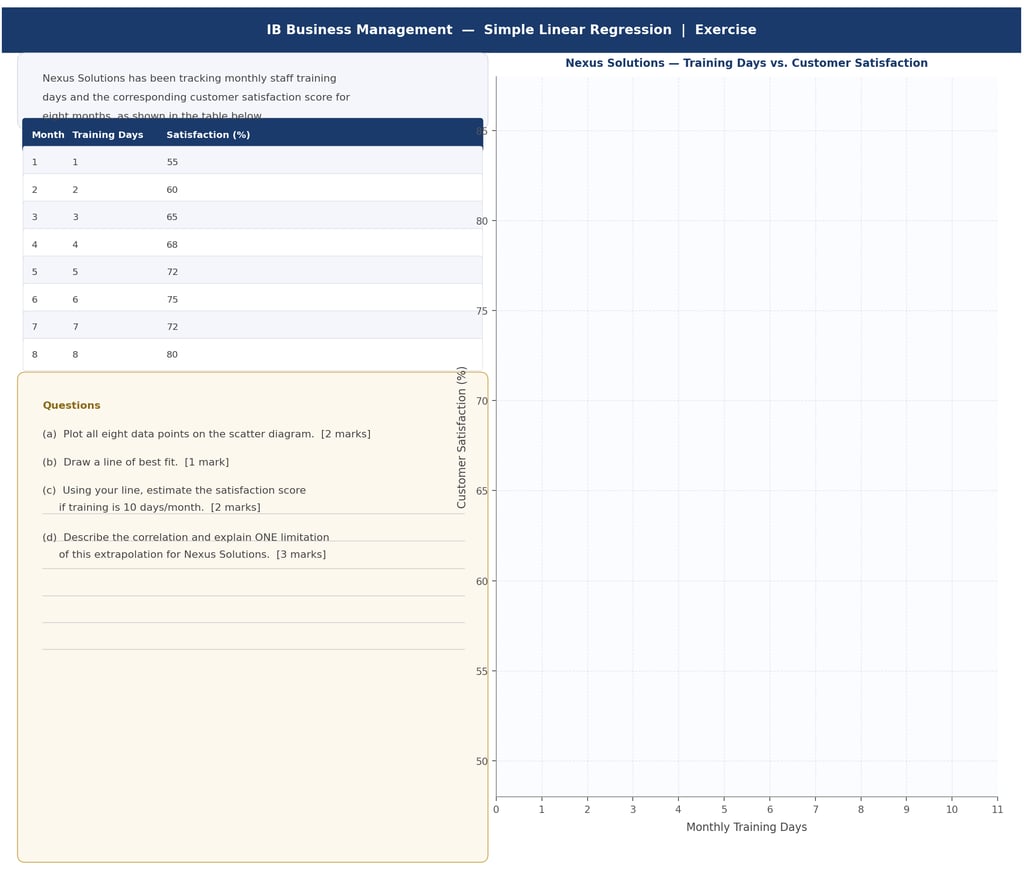
Nexus Solutions has been tracking monthly staff training days and customer satisfaction scores over eight months. Use the scatter diagram provided to answer all four questions.
Figure 3: Exercise for Nexus Solutions. Plot the data, draw the line of best fit, extrapolate to 10 training days, and describe the correlation and its limitations.
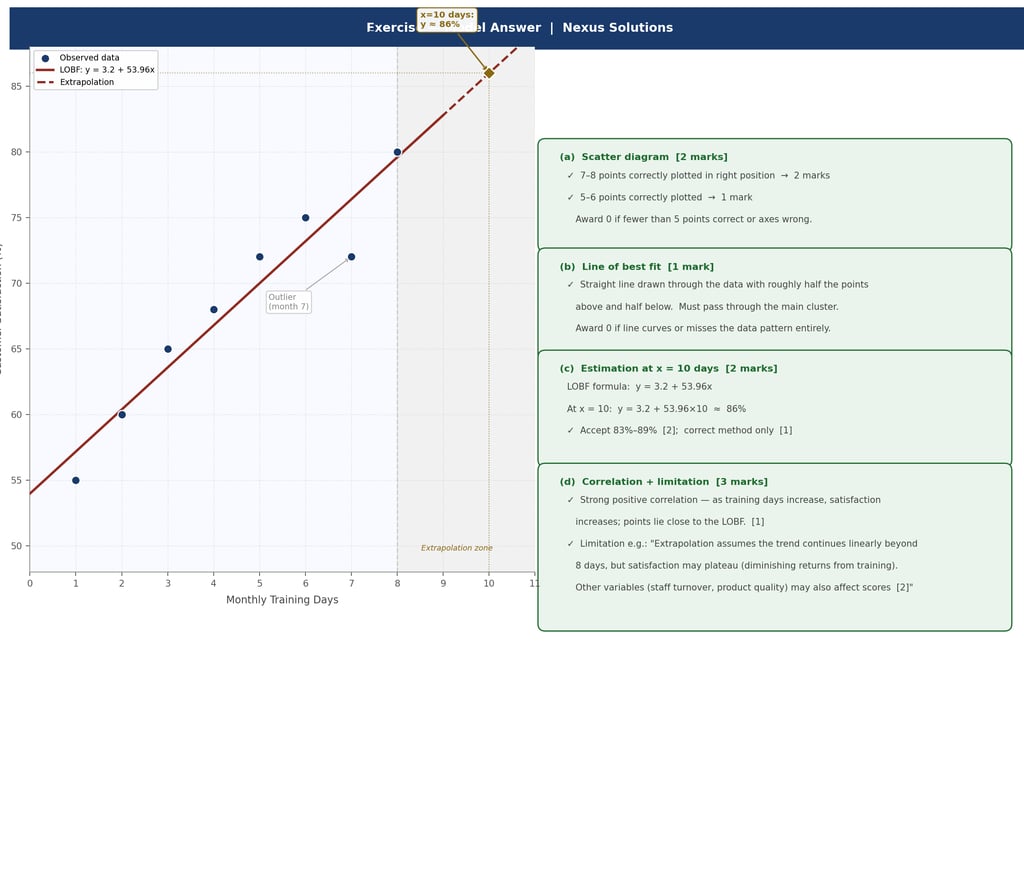
Model Answer
Figure 4: Model answer for Nexus Solutions showing all plotted points, the line of best fit, the extrapolated prediction at 10 training days, and the complete mark scheme.
Find Support For Practicing Simple Linear Regression
The IB Business Management Activity and Case Study Book includes a full Module 6 section with case studies across all 15 tools - Swot Analysis, Ansoff Matrix, Steeple Analysis, Boston Consulting Group (BCG) Matrix, Business Plan, Decision Trees, Descriptive Statistics, Circular Business Models, Gantt Charts (HL only), Porter’s Generic Strategies (HL only), Hofstede’s cultural dimensions (HL only), Force Field Analysis (HL only), Critical Path Analysis (HL only), Contribution (HL only), Simple Linear Regression (HL only) (All with worked exam responses and marking schemes aligned to every assessment objective.)
Exam Technique - Simple Linear Regression Questions
When plotting points: use a sharp pencil, plot carefully at the intersection of coordinates, and circle each point clearly. Use a ruler to draw the LOBF - a freehand line will lose marks.
When drawing the LOBF: aim for equal numbers of points above and below. Do not force the line through the origin unless the data suggests it passes there. If there is a clear outlier, use your judgement - the LOBF should reflect the overall trend, not be pulled towards a single extreme point.
When extrapolating: use a ruler to extend the LOBF, then drop a perpendicular from your target x-value to the line, and read the y-value. State your answer clearly: "From the LOBF, at x = 10 training days, the predicted satisfaction score is approximately 86%."
When describing correlation: always name the direction (positive/negative/none) AND the strength (strong/weak). Reference both variables by name: "There is a strong positive correlation between training days and customer satisfaction."
When evaluating extrapolation: the highest-mark answers explain why the limitation matters in the specific business context - not just that "it may be unreliable" in general.
Frequently Asked Questions: Simple Linear Regression in IB Business Management
What is simple linear regression in IB Business Management?
Simple linear regression is an HL statistical tool (AO2, AO4) in the IB Business Management Toolkit used to investigate the relationship between an independent variable (x) and a dependent variable (y). It uses a scatter diagram to plot observed data, a line of best fit to identify the underlying trend, and correlation analysis and extrapolation to make predictions. Common business applications include analysing the relationship between advertising spend and sales, or training hours and productivity.
What is a scatter diagram in IB Business Management?
A scatter diagram is a graphical representation of the relationship between two quantifiable variables. Each data point is plotted at the intersection of its x-value (independent variable) and y-value (dependent variable). The overall pattern of points reveals whether a positive, negative, or no correlation exists between the variables. Scatter diagrams can also reveal outliers - data points that lie far outside the main pattern, which may indicate errors or exceptional events.
What is the line of best fit and how do you draw it?
The line of best fit is a straight line drawn through a scatter diagram to represent the overall trend in the data. It is positioned so that approximately half the data points fall above the line and half below. To draw it by hand, identify the general direction of the data cluster, place your ruler through the midpoint of the data, and draw a straight line that minimises the visible gaps between the line and the points. The line should not be forced through any single data point, and should ignore obvious outliers when determining its position.
What is extrapolation and what are its limitations?
Extrapolation is the technique of extending the line of best fit beyond the observed data range to predict future or unknown values. It assumes the current linear trend will continue. Key limitations include: the assumption that the future resembles the past (which may not hold in dynamic markets); the increasing unreliability of predictions the further they extend beyond the data; the impact of outliers on the LOBF; the assumption of linearity when many real relationships eventually curve; and the correlation-causation problem - even a strong relationship may be driven by an unidentified third variable.
Does correlation mean causation in a scatter diagram?
No. A correlation in a scatter diagram shows that two variables tend to move together (or in opposite directions), but it does not prove that one variable causes the other to change. There may be a third confounding variable driving both, or the relationship may be coincidental. For example, a firm might find a strong positive correlation between the number of managers hired and sales revenue - but the real cause of higher sales may be increased investment in production capacity, not the managers themselves. Always acknowledge the correlation-causation distinction when evaluating scatter diagram findings in the IB exam.
Explore IB Business Management And Simple Linear Regression
IB Business Management Main Hub your daily IB Business Management resource
IB Business Management Simple Linear Regression in the Business Management Toolkit
IB Business Management Paper 1 Exam Review Hub find Simple Linear Regression exam questions in Paper 1
IB Business Management Paper 2 Exam Review Hub study Simple Linear Regression exam questions in Paper 2
IB Business Management Paper 3 Exam Review Hub explore Simple Linear Regression exam questions in Paper 3
IB Business Management Activity Book: Explore and practice The Business Management Toolkit including Simple Linear Regression, Unit 1 Swot Analysis, Unit 2 Ansoff Matrix, Unit 3 Steeple Analysis, Unit 4 Boston Consulting Group (BCG) Matrix, Unit 5 Business Plan, Unit 6 Decision Trees, Unit 7 Descriptive Statistics, Unit 8 Circular Business Models, Unit 9 Gantt Charts (HL only), Unit 10 Porter’s Generic Strategies (HL only), Unit 11 Hofstede’s cultural dimensions (HL only), Unit 12 Force Field Analysis (HL only), Unit 13 Critical Path Analysis (HL only), Unit 14 Contribution (HL only), Unit 15 Simple Linear Regression (HL only) activities, exam questions, case studies, IB Standard model answers and IB marking schemes.
Read Next: IB Business Management Toolkit Swot Analysis


© Theibtrainer.com 2012-2026. All rights reserved.
Legal
Have a Tip? Send us a tip using our anonymous form