
IB Economics GDP GNI & Circular Flow
Learn how to measure national income through GDP, GNI & the circular flow model. Perfect for IB Economics students tackling macroeconomics with confidence.
IB ECONOMICS MACROECONOMICSIB ECONOMICSIB ECONOMICS SLIB ECONOMICS HL
Lawrence Robert
4/21/202517 min read


How Do We Know If an Economy Is Working? Measuring Economic Activity, Explained
GDP, GNI, PPP - all key concepts of macroeconomics. Here's what it all actually means, and why it is extremely relevant for your IB Economics Paper 2 exam.
Target Question:
"What is the difference between GDP and GNI in IB Economics?"
The Problem With "Doing Well"
Let's go back to 2020 for a second, pandemic time. The whole world is locked inside. Factories are shut, shops are dark, restaurants exist only on Instagram memories. And yet, someone - somewhere in government - has to officially answer the question: how is the economy doing?
The answer, for the UK, was grim to say the least. Output collapsed by a record 10.3% that year. It was the worst peacetime fall in economic output since records began. But to know it had fallen by 10.3%, economists needed a way of measuring the economy in the first place. And that's exactly what this entry is about.
How do governments actually take the pulse of a national economy? How do they put a number on something as vast, complex, and heterogeneous as millions of people buying, selling, working, saving, and spending every single day?
The answer is national income accounting.
First Things First: What Is National Income Accounting?
National Income Accounting is a bookkeeping system used by governments to assess a country's total economic activity over a specific period - usually one a year. It tracks revenues earned by firms, wages paid to workers, and tax contributions made by both individuals and corporations.
It would be something similar to your personal bank statement - but for an entire country. Just as your bank statement captures everything going in and out of your account, national income accounting captures the economic activity of an entire nation. Instead of your Saturday coffee and weekly Spotify subscription, we're talking about factory output, government hospital spending, and for instance, the export earnings of Rolls-Royce when selling jet engines to Singapore Airlines.
The main tool governments use to do this? Gross Domestic Product - GDP. It's probably the most cited number in all of economics, and we're about to examine exactly what it means.
Three Ways to Measure the Same Thing
There are three completely different ways to measure a country's economic activity, and they all give you the same answer. It's like calculating how much water is in a swimming pool - you can measure the volume directly, count how many buckets you poured in, or measure how many buckets were poured out. Different method, same pool, same answer.
The three approaches are:
1. The Income Method
The Income Method measures national output by adding up the total value of all factor incomes earned in the economy in a year. This includes: wages and salaries (labour), rent (land), interest (capital), and profit (enterprise).
So if you earn £30,000 working at a hospital, that's captured. The landlord earning rent from your flat? Captured. The bank earning interest on loans? Captured. A company making a profit selling oat milk lattes? Also captured. Add all of these up across the entire country and you have national income.
2. The Output Method
The Output Method (also called the production method) measures national output by calculating the total value of all final goods and services produced within the economy during the year.
Understand it well. The crucial word here is final. Economists only count the value of finished products - not every stage of production. If a steel company sells steel to a car manufacturer, and the car manufacturer sells you a car, we only count the value of the car. Otherwise, we'd be double-counting the steel. This is the logic behind calculating value added at each stage of production.
3. The Expenditure Method
The Expenditure Method measures economic activity by adding up total spending on goods and services within the economy during the year. This gives us the most famous formula in macroeconomics:
GDP = C + I + G + (X − M)
Where:
C = Consumption - spending by households on goods and services (your Netflix, your Nando's, your new trainers)
I = Investment - spending by firms on capital goods to expand production capacity (new machines, factories, tech - sometimes called Gross Fixed Capital Formation)
G = Government Spending - public sector expenditure on goods and services (schools, NHS, roads - not benefits or pensions, which are transfer payments)
(X − M) = Net Exports - export earnings minus import spending. If the UK exports more than it imports, this figure is positive; if it imports more, it's negative
IB Economics Exam: Transfer payments - like unemployment benefits, state pensions, and child benefit - do NOT count as Government Spending (G) in the GDP formula. Why? Because they don't create new output. They're just money being redistributed from one group (taxpayers) to another (recipients). No new goods or services are produced, so they don't count.
All three methods give the same final number:
National Output (O) = National Income (Y) = National Expenditure (E)
Every pound of output produced generates an equivalent pound of income for a factor of production - and that income is then spent on the goods and services produced. The economy is a loop.
The Circular Flow of Income - The Visual Loop
Speaking of loops - let's talk about the Circular Flow of Income model. If the GDP formula is the maths, the circular flow is the visual representation. It shows visually how money moves around an economy through the decisions of different actors.
Imagine the economy as a massive group where money keeps getting passed around:
Households provide labour (and other factors of production) to firms, who pay them wages, rent, interest, and profits. Households then use this income to buy goods and services from firms - and round we go.
Firms produce goods and services, pay factor incomes, and invest in capital.
The government taxes households and firms, and uses that revenue to spend on public services.
Financial institutions collect household savings and lend them to firms for investment.
The overseas sector buys our exports (an injection of money into the economy) and sells us imports (money leaving the economy).
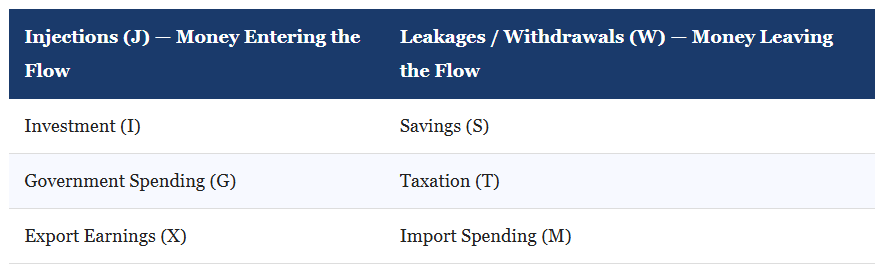
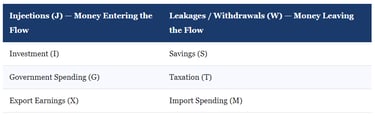
Injections and Leakages
The circular flow gets more interesting when you account for money that enters or leaves the main loop.
For access to all IB Economics exam practice questions, model answers, IB Economics complete diagrams together with full explanations, and detailed assessment criteria, explore the Complete IB Economics Course
The relationship between injections and leakages determines whether the economy grows or shrinks.
If J > W (injections exceed leakages) → economic activity increases
If W > J (leakages exceed injections) → economic activity declines
If J = W → the economy is at equilibrium national income - meaning (S + T + M) = (I + G + X)
IB Economics Real-life example: During the COVID-19 pandemic in 2020, savings shot up (people couldn't spend), imports fell, but so did investment and exports. The UK government responded by massively increasing G - through the furlough scheme (£70 billion+), grants, and loans - to inject money back into the circular flow and prevent a total collapse. It was still a brutal recession, but not as devastating as the 2008 financial crisis, which saw the flow drain far more slowly over several years.
IB Economics Syllabus Note: The circular flow of income model appears three times in the IB Economics syllabus - in Unit 1.1 (Introduction to Economics), Unit 2.2 (Microeconomics HL only), and Unit 3.1 (Macroeconomics). Make sure you can draw it with both leakages and injections labelled clearly.
Nominal GDP
Right, so we know what GDP measures. But which GDP? Because there are a few versions, IB Economics will test you on the differences.
Nominal GDP measures the total value of all final goods and services produced within a country in a year, using current prices - the actual prices at the time of measurement. It is not adjusted for inflation.
Suppose the UK's nominal GDP rises from £2.5 trillion to £2.6 trillion in a year. Sounds great, right? But what if prices rose by 5% that year? Then some - or possibly all - of that increase isn't because the economy produced more stuff. It's just because everything got more expensive. We haven't actually grown in any meaningful sense.
This is why economists invented Real GDP.
Real GDP - The Number That Actually Tells You Something Valuable
Real GDP is nominal GDP adjusted for inflation using a GDP deflator (also called a price deflator). It expresses output at constant prices - the prices of a chosen base year - removing the distorting effect of price changes.
The formula is:
Real GDP = Nominal GDP ÷ GDP Deflator
For example, if the GDP deflator is 1.065, it means prices have risen by 6.5% since the base year. Dividing nominal GDP by 1.065 strips out that price increase, leaving you with a "real" figure - one that reflects actual changes in output, not just inflation.
IB Economics Real-life example: UK 2024/25 The UK's nominal GDP grew by 5.2% in 2024. Impressive! But strip out inflation with the GDP deflator, and real GDP growth was just 1.1%. That's the difference between nominal and real - and why economists (and your IB Economics examiner) always prefer the real figure for comparing economic performance over time.
IB Economics Exam Tip: "Current prices" = nominal (inflation included). "Constant prices" = real (inflation removed). These phrases appear in exam data response questions constantly. Don't mix them up.
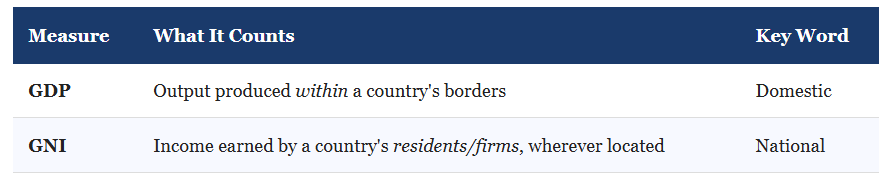
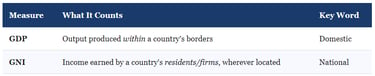
GDP vs GNI - Location, Location, Location
Here's a question: if Apple - an American company - makes billions of pounds of profit from its UK operations, does that count in the UK's GDP or the USA's?
In the UK's GDP. Because GDP measures output produced within a country's borders, regardless of who owns the company.
But what if we want to know how much income a country's own residents and companies are actually earning - wherever they are in the world? That's where GNI comes in.
Gross National Income (GNI) measures the total income earned by a country's residents and firms from all production factors - regardless of where in the world those factors are located.
The formula is:
Nominal GNI = Nominal GDP + Net Factor Income from Abroad
Net factor income from abroad includes net interest, profits, and dividends earned by a country's firms and residents operating overseas, minus those earned by foreign firms and residents operating domestically.
IB Economics Real-life example: Tesco operates in several countries. The profit Tesco earns from its Central European stores counts in the UK's GNI (British company earning abroad), but not in UK's GDP (not produced within UK borders). Meanwhile, the profit BMW earns from its Mini factory in Oxford counts in UK GDP (produced here) but not UK GNI (profits flow back to Germany).
IB Economics Diagrams Programme, What's included:
200+ exam-ready diagrams covering the entire IB Economics syllabus
Video for every diagram showing you exactly how each model looks
Image version perfect for modelling diagrams in you essays, presentations, and your IA
Detailed written explanations of the IB Economics theory behind each diagram
Both SL and HL IB Economics diagrams clearly labelled and organised by topic
Real IB Economics exam application showing how to use diagrams effectively in Paper 1 and Paper 2
IB Economics Real-life example: Ireland is the classic case study here. Its GDP is significantly higher than its GNI because massive US multinationals (Google, Apple, Meta) book enormous profits through Dublin - inflating Ireland's GDP - but that money flows back to American shareholders, so it doesn't reflect what Irish residents actually earn. This is why economists often prefer GNI for Ireland as a measure of living standards.
When the Money Leaves: Profit Repatriation and the GDP–GNI Gap
Right - my students often have issues understanding the following concept, and it's worth spending proper time on this. Because this is where the GDP–GNI distinction stops being just theory and becomes a genuinely important real-world economics practical issue. One that may show up in IB Economics Paper 2 data response questions.
What happens when capital is generated in one economy, but instead of being reinvested locally, it gets transferred back to another country?
That process is called profit repatriation. And it's one of the most significant reasons why GDP can give a misleading picture of how well-off the people in a country actually are.
What Is Profit Repatriation?
Profit repatriation occurs when a multinational corporation (MNC) transfers the profits it has earned in a host country back to its home country (or to a third-country tax haven), rather than reinvesting those profits in the local economy. These outflows are subtracted from the host country's GNI - but they still count towards that country's GDP, because the output was produced domestically.
Imagine a massive gold mine opens in a developing country. Foreign investors build it, foreign firms manage it, and foreign shareholders own it. The mine produces millions of pounds' worth of gold every year - all of which gets counted in that country's GDP. But when the profits are bundled up and wired to London, New York, or a holding company in the Cayman Islands? That money leaves the circular flow entirely. It doesn't pay local wages (beyond the basic workforce), it doesn't fund local schools or hospitals, and it doesn't get reinvested in local businesses. The country got the GDP headline. The people got very little.
This is the GDP–GNI gap in action. And for many developing economies, it's enormous.
Ireland: The Poster Child
Let's expand on the Ireland example. In the 1990s and 2000s, Ireland aggressively courted US multinationals - Apple, Google, Meta, Microsoft - by offering one of the lowest corporate tax rates in the developed world (12.5%, compared to over 30% in the US at the time). The strategy worked spectacularly in terms of raw GDP numbers. Ireland's GDP per capita became one of the highest in the world on paper.
Companies like Apple, Google, and Microsoft booked enormous profits through Dublin - but a significant proportion of those profits were subsequently repatriated back to the United States, flowing to American shareholders rather than recirculating in the Irish economy. The result? Ireland's GDP is actually significantly larger than its GNI because of the repatriation of profits by companies resident in Ireland. For a while, the gap was so extreme that Irish economists basically stopped using GDP to measure their own economy, switching instead to a modified measure called Modified Gross National Income (GNI*) - literally because their own GDP figures had become almost meaningless as a measure of Irish living standards.
IB Economics Exam Application: Ireland is the go-to example when discussing why GDP can overstate living standards in countries with large MNC presences. If a Paper 2 question gives you data showing a country's GDP rising strongly but GNI remaining flat or falling, profit repatriation by multinationals is almost certainly the explanation. Say so explicitly and you'll pick up evaluation marks.
When GNI Exceeds GDP
Not all countries lose out on net factor income from abroad - some gain significantly.
IB Economics Real-life example: Norway and Qatar, both countries have GNI higher than their GDP. Norway runs a sovereign wealth fund - the world's largest - built from North Sea oil revenues, which is invested in assets globally. The returns from those overseas investments flow back to Norwegian residents, pushing GNI above GDP. Qatar similarly earns enormous income from its overseas energy investments. In these cases, the country's residents earn more than what's produced domestically - the opposite of the repatriation problem.
And then we have remittances.
IB Economics Real-life example: The Philippines, because of large remittances from abroad, GNI in the Philippines greatly exceeds GDP - by around 10% in recent years. Millions of Filipino workers are employed overseas - as nurses in the UK, seafarers on global shipping routes, domestic workers in the Gulf states - and they send money back home every month. This income boosts GNI without showing up in domestic GDP at all. For the Philippines, GDP actually understates how much income Filipino households have access to. The circular flow gets an injection from abroad that domestic production statistics simply don't show.
Extractive Industries and the Development Trap
Profit repatriation connects directly to IB Development Economics exactly at this stage. Particularly in low-income countries with valuable natural resources - oil, copper, cobalt, lithium, gold. The pattern is quite familiar:
A foreign MNC arrives, attracted by cheap labour and natural resources
The MNC invests in extraction infrastructure - mines, pipelines, processing plants
Output (and GDP) rises sharply on paper
Profits flow back to shareholders in the home country
The local economy is left with some tax revenue (often minimal, especially if the government offered tax incentives to attract the MNC in the first place), some low-wage jobs, and environmental damage
GNI - the measure that actually reflects what residents earn - barely moves
This dynamic is sometimes called the resource curse - the paradox where countries rich in natural resources often show worse economic development outcomes than those without them. Profit repatriation is a central mechanism of the curse.
IB Economics Real-life example: Sub-Saharan Africa, foreign Direct Investment (FDI) into Africa has historically been targeted to extractive sectors - oil, gas, and mining. While this investment does raise GDP figures and creates some employment, the profits generated are overwhelmingly transferred back to multinational headquarters in Europe, North America, and increasingly China. European FDI into Africa fosters long-term capital inflows and technology transfer, but also carries significant risks of foreign control and profit repatriation. The result is a persistent gap between what African economies produce (GDP) and what African citizens actually receive as income (GNI). Development economists increasingly argue that measuring African economic progress using GDP alone is deeply misleading for this reason.
Does Repatriation Mean FDI Is Not Right?
Not necessarily - and this is the nuanced evaluation point your IB Economics examiner would love to see. Foreign Direct Investment and the multinationals that bring it do generate some genuine benefits for host countries:
Employment - jobs are created, even if wages are often low
Tax revenues - even with generous tax deals, some corporation tax is collected and can fund public services
Infrastructure - roads, ports, and power infrastructure built to serve MNC operations can benefit local communities too
Technology and skills transfer - local workers gain skills, and domestic suppliers can learn from multinational supply chains
Multiplier effects - MNC workers spend wages locally, injecting money into the circular flow
The problem isn't that multinationals exist - it's the terms on which they operate. Governments that negotiate better deals (higher local content requirements, reinvestment obligations, stronger tax frameworks) can retain more of the value created domestically.
IB Economics Real-life example: Costa Rica is a positive example: by targeting high-value FDI in medical devices and technology rather than just raw extraction, it has attracted more than 90 multinational MedTech companies, creating over 55,000 jobs - most of them skills-intensive - and building a genuinely productive local ecosystem rather than simply watching profits leave.
IB Economics Evaluation Point: A rising GDP does not automatically mean rising living standards if large proportions of that output are owned by foreign multinationals and profits are repatriated abroad. This is why GNI - and specifically GNI per capita, adjusted for PPP - is generally considered a better measure of actual welfare than raw GDP. Always bring this distinction into essay evaluations about economic growth, development, and the role of MNCs.
And yes - just like GDP, we prefer Real GNI (inflation-adjusted) over Nominal GNI when making comparisons over time.
GDP and GNI Per Capita - Sharing the Pie
Ok my dear students, here's another problem. Say Country A has a GDP of $1 trillion. Country B also has a GDP of $1 trillion. So are they equally wealthy?
Not necessarily. What if Country A has 10 million people and Country B has 500 million? The same total output is being shared among very different numbers of people. This is why we use per capita (per person) figures.
Real GDP per capita = Real GDP ÷ Population Size
Real GNI per capita = Real GNI ÷ Population Size
These figures give us a rough measure of the average standard of living within a country - how much output or income exists per person.
IB Economics Real-life example: UK GDP per Capita Paradox, the UK's real GDP grew by 1.1% in 2024. But the UK's population also grew - faster than the economy. The result? Real GDP per capita actually showed no growth in 2024. The economy got bigger, but there were more people to share it with.
IB Economics Exam Insight: GDP per capita is an average. It doesn't tell you anything about inequality - whether that wealth is evenly spread or concentrated in the hands of a few. A country with a very high GDP per capita could still have enormous poverty if wealth is highly unequal. This concept is usually Paper 1 assessment material.
Every episode of Pint-Sized links back to what matters most for your IB Economics course:
Understanding key IB Economics concepts
Applying them in real-world IB Economics contexts
Building IB Economics course confidence without drowning in dry theory.
Subscribe for free to exclusive episodes designed to boost your IB Economics grades and confidence
PPP - Because £10 Isn't £10 Everywhere
Imagine you earn £2,000 a month in London. You can afford a small flat probably 1 hour away by train from the town centre, some food, and maybe one treat per week. Now imagine you earn the equivalent in Krakow, Poland. Here, you're living comfortably - dining out regularly, renting a spacious apartment in the city centre, travelling on weekends. Same number in different currencies. Completely different living standard.
This is the core problem with comparing GDP or GNI across countries. Exchange rates don't capture what money actually buys in each country. That's the job of Purchasing Power Parity (PPP).
Purchasing Power Parity (PPP) is the exchange rate that would allow people in one country to buy the same basket of goods and services as people in another country. It adjusts for differences in price levels between countries, allowing more meaningful comparisons of real living standards.
PPP-adjusted figures are particularly useful when comparing rich and developing countries. A salary of $10,000 per year looks very different in the US versus India - in India, that income goes much further because prices are substantially lower.
IB Economics Real-life example: The Big Mac Index - PPP Made Delicious, since 1986, The Economist magazine has published the Big Mac Index - one of the most famously accessible tools in all of economics. The idea is simple: a McDonald's Big Mac is (roughly) the same product everywhere in the world. So if you compare its price in different countries, you get a quick snapshot of purchasing power parity in action. In January 2025, Switzerland had the world's most expensive Big Mac at around $7.99. The UK's was approximately $5.73. Taiwan had the cheapest at just $2.38. This tells us that the Swiss franc is overvalued relative to the Taiwanese dollar when measured purely by what your money can buy.
The index isn't perfect - local wages, taxes, and competition all distort prices - but it makes PPP instantly understandable. Even to a 16-year-old who's never hear of economics before.
Criticisms of PPP
PPP is useful, but it has real limitations that your IB Economics examiner will want you to acknowledge:
The basket of goods used is not necessarily representative of what average residents in each specific country actually buy. A basket designed for American consumers may not reflect typical spending in rural Vietnam.
Only certain products are included - the basket inevitably leaves things out.
PPP calculations are complex and costly to produce accurately, requiring large-scale international price surveys.
They are updated infrequently, meaning the data can quickly become outdated in fast-changing economies.
IB Economics Real-life example: PPP Changes Everything - China vs USA, when you measure GDP using market exchange rates, the United States has the world's largest economy. But when you adjust for PPP - accounting for the fact that goods and services are substantially cheaper in China - China actually takes the top spot. The country with the largest GDP in the world depends entirely on whether you measure it in nominal terms or PPP-adjusted terms. That's how powerful this concept is.
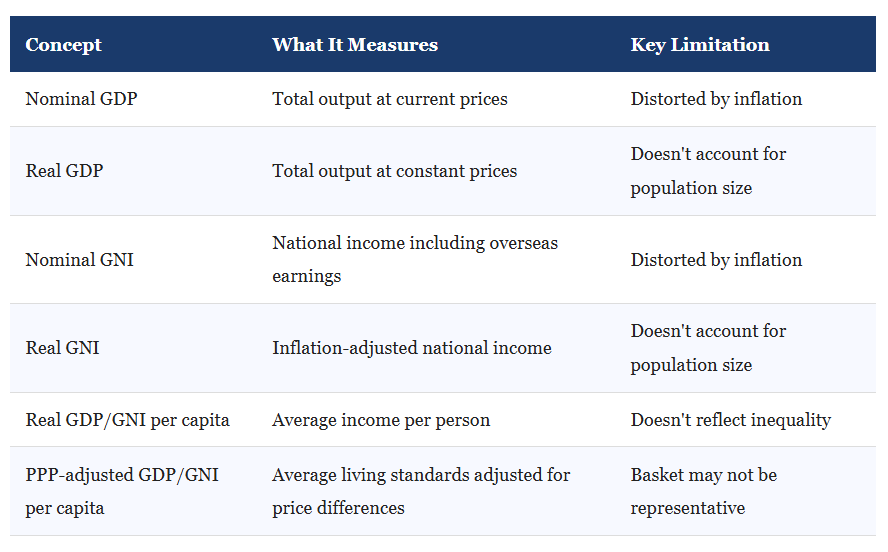
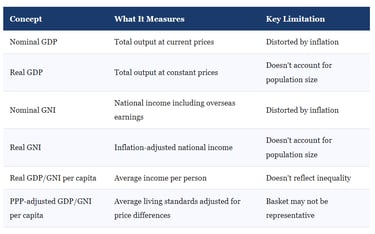
IB Economics Summary
Here's the quick-reference summary:
All three methods of measuring economic activity (income, output, expenditure) will always produce the same result, because national output = national income = national expenditure.
It's the same economic reality viewed from three different angles.
FAQ
Q: What is GDP in simple terms?
GDP (Gross Domestic Product) is the total value of all finished goods and services produced within a country's borders in a given year. It's the most widely used measure of a country's economic size and growth.
Q: What is the difference between nominal and real GDP?
Nominal GDP uses current prices, meaning it includes the effects of inflation. Real GDP strips out inflation using a price deflator, giving a more accurate picture of whether an economy has actually produced more or just charged more. Economists always prefer real GDP for comparing performance over time.
Q: What is the difference between GDP and GNI?
GDP measures the value of output produced within a country's borders, regardless of who owns the businesses. GNI measures income earned by a country's own residents and firms, wherever in the world they operate. The difference is net factor income from abroad - profits, interest, and dividends flowing in and out of the country.
Q: What does GDP per capita measure?
GDP per capita divides a country's total GDP by its population, giving an average output (or income) per person. It's used as a rough indicator of living standards, though it doesn't account for how equally that income is distributed across society.
Q: What is Purchasing Power Parity (PPP) and why is it relevant?
PPP is an adjustment that accounts for the fact that the same amount of money buys different quantities of goods in different countries. When comparing living standards internationally, PPP-adjusted GDP or GNI per capita gives a far more meaningful picture than raw exchange-rate figures. The Big Mac Index is a famous informal example of PPP in action.
Stay well,
Explore Topics:
IB Economics Calculations Book Access Unit 15 for practicing the GDP deflator formula and Real GDP calculations
IB Economics Macroeconomics Hub Page quick reference to all IB Economics Macroeconomics topics
IB Economics Diagrams Page to access all IB Economics Diagrams
Exchange rates Hub Page for exploring net exports (X–M) and PPP
IB Economics Activity book access unit 3.2 to practice exam questions and activities together with model answers and IB marking schemes.
Read Next: IB Economics Beyond GDP Measuring Happiness
© Theibtrainer.com 2012-2026. All rights reserved.
Legal
Have a Tip? Send us a tip using our anonymous form