
IB Economics Business Cycle
Target Question:
What is the business cycle in IB Economics and what are its four phases?
Everything you need to understand and evaluate the business cycle for your IB Economics course - phases, graphs, output gaps, indicators, policy responses, and cross-topic connections.
Full business cycle activity practice breakdown, exam practice, model answers and evaluation tools are available exclusively in the IB Economics Activity Book and IB Economics Calculations book.
What Is the Business Cycle?
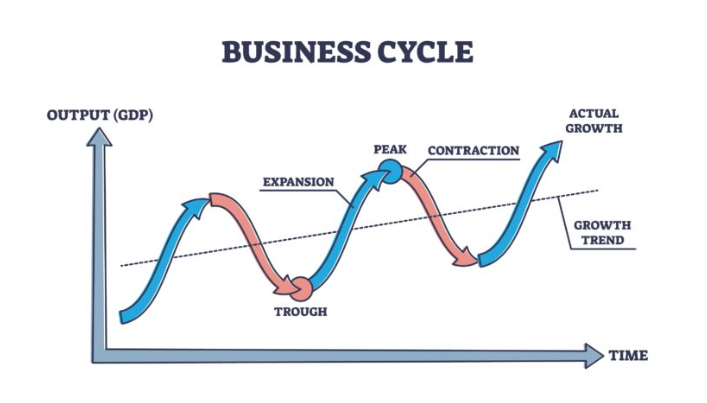
The business cycle (also called the economic cycle or trade cycle) describes the recurring pattern of expansion and contraction in real GDP around a long-run trend growth path. Market economies do not grow smoothly - they fluctuate, alternating between periods of above-trend growth and below-trend contraction.
These fluctuations are measured as deviations of actual GDP from potential GDP (the maximum sustainable output the economy can produce with its existing resources and technology). The gap between actual and potential GDP is the output gap - positive when the economy is overheating, negative when it is operating below capacity.
IB Economics definition:
The business cycle is the short-run fluctuation of real GDP around its long-run trend growth path, characterised by alternating phases of expansion and contraction. The output gap measures the difference between actual GDP and potential GDP at any point in the cycle, creating either inflationary pressure (positive gap) or deflationary pressure and unemployment (negative gap).
The Four Phases of the Business Cycle
1. Expansion
During the expansion phase, real GDP is growing - typically at or above trend rate. Key characteristics:
Employment rises and unemployment falls
Consumer and business confidence is high
Investment increases as firms anticipate continued growth
Credit conditions are loose - banks lend freely
Asset prices (property, equities) typically rise
As expansion matures into a boom, the economy operates above potential GDP - a positive output gap. Spare capacity is exhausted, labour markets tighten, wage pressure builds, and inflationary pressure increases. Overheating becomes a policy concern.
2. Contraction (Downturn)
Economic growth slows and eventually turns negative. Confidence falls, investment declines, and unemployment begins to rise. A recession is technically defined as two consecutive quarters of negative real GDP growth - though in practice, economists look at a broader set of indicators including employment, industrial production, and retail sales.
Key characteristics of contraction:
Real GDP falls
Unemployment rises as firms cut hiring and shed workers
Investment collapses - firms cancel or defer capital expenditure
Consumer spending falls as confidence and real incomes decline
Credit conditions tighten - banks become more cautious
A depression is a severe, prolonged recession - characterised by mass unemployment, deflation, and a collapse in output significantly greater than a normal recession. The 1930s Great Depression remains the defining historical example.
3. Trough
The trough is the lowest point of the cycle - the point at which real GDP stops falling and begins to stabilise. At the trough, unemployment typically peaks (unemployment is a lagging indicator that peaks after GDP has already started recovering), confidence is at its lowest, and the economy is operating well below potential GDP - a large negative output gap.
4. Recovery
During recovery, real GDP begins to grow again from the trough. Investment picks up as inventories need replenishing, consumer confidence gradually returns, and policy stimulus (if applied) begins to take effect. Different recovery shapes are possible:
V-shaped - rapid, sharp recovery; GDP returns quickly to pre-recession levels
U-shaped - slow, prolonged recovery with an extended period at the trough
L-shaped - stagnation; GDP falls and fails to return to pre-recession levels for an extended period
W-shaped (double-dip) - initial recovery followed by a second contraction before sustainable growth resumes
The COVID-19 recession of 2020 produced an unusually sharp V-shaped recovery in most advanced economies - the steepest GDP fall on record, followed by a rapid rebound as lockdowns lifted and sudden demand released. The 2008-09 Global Financial Crisis produced a more prolonged U-shaped recovery as the banking system required years to repair balance sheets.
Output Gaps and Their Implications
The output gap is central to business cycle analysis in IB Economics - it determines the appropriate policy response and connects directly to inflation and unemployment.
Positive output gap (actual GDP > potential GDP):
Economy is overheating - operating beyond sustainable capacity
Labour markets are tight; wage inflation builds
Price inflation rises as firms can charge more
Policy implication: contractionary fiscal or monetary policy to cool demand
Negative output gap (actual GDP < potential GDP):
Economy is underperforming - spare capacity and unemployment
Deflationary pressure; firms struggle to raise prices
Cyclical unemployment is above the natural rate
Policy implication: expansionary policy to stimulate demand
Business Cycle Indicators
Leading indicators - change before the economy turns; useful for predicting cycle phases:
Business confidence surveys (PMI indices)
Stock market performance
New housing permits and building starts
Consumer confidence indices
Yield curve shape (an inverted yield curve - where short-term rates exceed long-term rates - has historically preceded recessions)
Coincident indicators - change at the same time as the economy:
Real GDP
Industrial production
Retail sales
Lagging indicators - change after the economy has already turned:
Unemployment rate (firms are slow to hire and fire; unemployment peaks after recession and falls after recovery has begun)
Business investment
Outstanding loans
The Multiplier and Accelerator
Two mechanisms amplify business cycle fluctuations beyond their initial trigger.
The multiplier - an initial injection of spending (government investment, export revenue, business investment) generates further rounds of income and spending as recipients spend a proportion of their income, which becomes income for others, and so on. The size of the multiplier depends on the marginal propensity to withdraw (tax, savings, imports): multiplier = 1/MPW.
In a downturn, the multiplier works in reverse: an initial fall in spending (a firm cutting investment, consumers losing confidence) triggers cascading reductions in income and spending throughout the economy - amplifying the contraction.
The accelerator - investment spending is highly sensitive to changes in the rate of economic growth, not just at the level of growth. When output is growing rapidly, firms invest heavily to expand capacity. When growth slows (even if output is still positive), the accelerator predicts a sharp fall in investment - because firms no longer need to add capacity. This makes investment extremely volatile over the cycle.
The interaction of multiplier and accelerator - where falling investment reduces income (multiplier), which further reduces investment (accelerator) - explains why recessions can escalate rapidly once they begin.
Policy Responses to the Business Cycle
Monetary Policy
Central banks raise interest rates during booms (cooling demand, reducing the positive output gap) and cut rates during recessions (stimulating demand, closing the negative output gap). When rates reach zero - the zero lower bound - quantitative easing (asset purchases) provides additional stimulus.
Limitations: monetary policy works with significant time lags (12-24 months for full effect); it cannot address supply-side or structural problems; and at the zero lower bound, conventional tools are exhausted.
Fiscal Policy
Automatic stabilisers moderate cycles without government decision-making: tax revenues fall and benefit spending rises automatically during recessions, injecting demand; the reverse occurs in booms. Progressive income taxes and unemployment benefits are the main stabilisers.
Discretionary fiscal policy - deliberate changes to government spending or taxation - can amplify automatic stabilisers during severe downturns. The 2008-09 crisis produced coordinated global fiscal stimulus; the COVID-19 recession produced the largest peacetime fiscal expansion in history.
Limitations: discretionary policy suffers from recognition lag (time to identify the problem), decision lag (political process), and impact lag (time for spending changes to affect the economy). By the time stimulus takes effect, the cycle may have already turned. Pro-cyclical fiscal policy - cutting spending during a recession to balance the budget - can deepen the contraction.
Classical vs Keynesian Perspectives
The appropriate policy response depends on one's view of how economies self-correct:
Classical/Monetarist view: markets self-correct efficiently - wages and prices adjust to clear markets, returning the economy to potential GDP without intervention. Government intervention is unnecessary and may cause more harm than good through timing errors and crowding out.
Keynesian view: wages and prices are sticky downward - markets do not self-correct quickly, particularly during recessions. Unemployment can persist for years without active fiscal stimulus. Government intervention is necessary to close negative output gaps within an acceptable timeframe.
Modern consensus acknowledges both: automatic stabilisers are broadly accepted; the debate centres on the appropriate scale and timing of discretionary fiscal intervention.
Business Cycle Connections in IB Economics
Phillips Curve - the most direct cross-topic connection. The SRPC models the trade-off between unemployment and inflation that maps onto the business cycle: booms generate inflationary pressure (moving up and left along the SRPC); recessions create unemployment (moving down and right). Stagflation - simultaneous high inflation and high unemployment - occurs when a supply shock shifts the SRPC upward.
AD/AS model - the business cycle is represented in the AD/AS framework as movements in aggregate demand along an upward-sloping AS curve. Demand shocks shift AD; supply shocks shift AS. The output gap is visible as the distance between actual output and potential output (LRAS).
Economic growth - distinguishing cyclical fluctuations from long-run growth is essential: the business cycle describes movement around the trend; economic growth describes the movement of the trend itself (the LRAS curve shifting rightward).
IB Economics Fiscal Policy - Full Guide →
IB Economics Monetary Policy - Full Guide →
IB Economics Phillips Curve - Full Guide →
IB Economics Economic Growth - Full Guide →
IB Economics Diagrams Course
Every business cycle diagram - the cycle curve with all four phases labelled, output gap diagrams, AD/AS representation of expansion and recession - fully labelled with video walkthroughs.
✔ Business cycle diagram with trend growth line and output gaps
✔ AD/AS expansion and contraction diagrams
✔ Positive and negative output gap illustrations
✔ 200+ diagrams covering the full syllabus · Both SL and HL labelled
Frequently Asked Questions: The Business Cycle in IB Economics
What are the four phases of the business cycle in IB Economics? The four phases are: expansion (real GDP growing, employment rising, confidence high); boom/peak (GDP at or above potential, positive output gap, inflationary pressure); contraction/recession (GDP falling for two or more consecutive quarters, unemployment rising, investment collapsing); and trough (the lowest point, maximum unemployment, before recovery begins). Recovery then leads back into expansion, completing the cycle.
What is an output gap in IB Economics? The output gap is the difference between actual real GDP and potential GDP - the maximum sustainable output the economy can produce. A positive output gap means the economy is operating above potential (overheating, inflationary pressure). A negative output gap means it is operating below potential (spare capacity, cyclical unemployment, deflationary pressure). Output gaps determine whether expansionary or contractionary policy is appropriate.
What is the difference between automatic stabilisers and discretionary fiscal policy? Automatic stabilisers are built-in features of the tax and benefit system that respond automatically to the cycle - tax revenues fall and benefit spending rises during recessions, injecting demand without any government decision. Discretionary fiscal policy requires active government decisions - announcing new spending programmes or tax changes. Automatic stabilisers operate immediately; discretionary policy suffers from time lags that can reduce effectiveness or even destabilise the cycle if poorly timed.
What is the accelerator principle and how does it amplify the business cycle? The accelerator principle states that investment depends on the change in output, not its level. When output is growing rapidly, firms invest heavily to expand capacity. When growth slows, investment falls sharply - even if output is still positive. This makes investment highly volatile: during a boom, accelerator effects amplify expansion; during a downturn, collapsing investment (via the multiplier) amplifies the contraction further.
How do the Keynesian and Classical views of the business cycle differ? Classical economists believe markets self-correct through flexible wages and prices - a recession will end as wages fall, restoring employment, and prices fall, restoring spending. Government intervention is unnecessary and risks making things worse. Keynesian economists argue wages and prices are sticky downward - markets do not self-correct quickly, particularly in recessions. Without active fiscal stimulus, unemployment can persist at high levels for years, justifying government intervention to close negative output gaps.
This hub is updated regularly to reflect current IB Economics syllabus requirements.
More information about:
IB Economics Hub Page your IB Economics daily guide
IB Economics Macroeconomics Hub Page for Business Cycle as well as measuring economic activity and its variations contents
IB Economics Diagrams Page Check Unit 15 for the Business Cycle and Measuring Economic Activity related diagrams and explanations
IB Economics Activity book Page Module 3 Macroeconomics Unit 3.4 for the Business Cycle exam practice, activities, model answers and IB Economics Marking schemes
IB Economics Aggregate Demand and Aggregate Supply - Content you need to master in order to understand the effect of the business cycle, revise this theory
IB Economics Fiscal Policy Hub Page for exploring in depth fiscal responses to the Business Cycle.
IB Economics Monetary Policy Hub Page learn how monetary policy can help through the different business cycle stages
IB economics Calculations Book make sure you check unit 15 for the Business Cycle and Measuring Economic Activity calculations exercises, calculation exam-style questions, IB model answers, and IB marking schemes
© Theibtrainer.com 2012-2026. All rights reserved.
Legal
Have a Tip? Send us a tip using our anonymous form