
IB Phillips Curve
Target Question:
What is the Phillips Curve and how is it used in IB Economics?
Full activity practice breakdown, exam practice, model answers and evaluation tools are available exclusively in the IB Economics Activity Book.


IB Economics: The Phillips Curve - Complete Hub
Everything you need to understand, and evaluate the Phillips Curve for your IB Economics course - from the original trade-off to stagflation, the NAIRU, modern monetary policy, and Phillips Curve diagrams.
What Is the Phillips Curve?
The Phillips Curve describes the empirical relationship between unemployment and inflation in an economy. Named after New Zealand economist A.W. Phillips, who in 1958 observed an inverse relationship between wage inflation and unemployment in the UK from 1861 to 1957, the curve became one of the most influential - and later most contested - frameworks in macroeconomics.
The basic insight is intuitive: when unemployment is low, workers have greater bargaining power, wages rise, firms face higher costs, and prices increase. When unemployment is high, wage pressure eases and inflation falls. This creates an apparent policy menu - governments could choose to accept higher inflation in exchange for lower unemployment, or lower inflation at the cost of higher unemployment.
IB Economics definition:
The Phillips Curve illustrates the short-run inverse relationship between the rate of unemployment and the rate of inflation. In the long run, the curve is vertical at the Natural Rate of Unemployment (NRU/NAIRU), implying no permanent trade-off between unemployment and inflation.
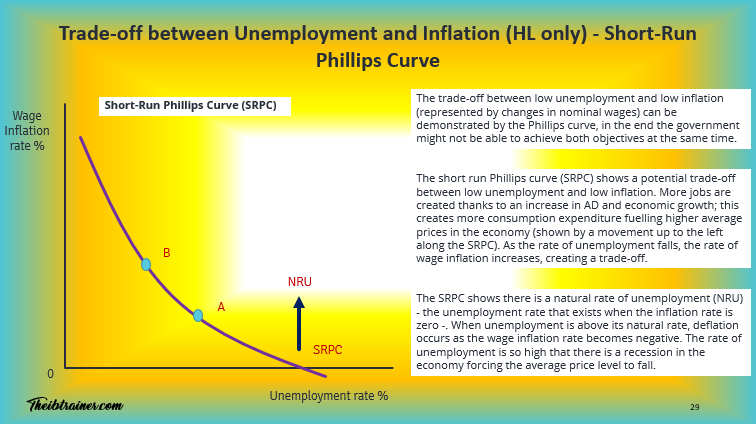
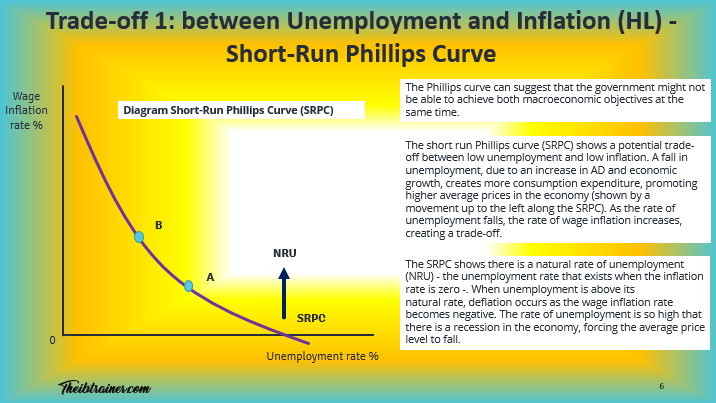
The Short-Run Phillips Curve (SRPC)
The Short-Run Phillips Curve (SRPC) shows a downward-sloping relationship between unemployment and inflation. Movement along the SRPC occurs when governments use demand management policies:
Expansionary fiscal or monetary policy increases aggregate demand, reduces unemployment, but pushes inflation higher - a movement up and to the left along the SRPC
Contractionary policy reduces inflation but increases unemployment - a movement down and to the right
The slope of the SRPC is significant for policy: a steep SRPC means even small reductions in unemployment cause large increases in inflation; a flat SRPC means governments can reduce unemployment significantly with only modest inflationary consequences.
Shifts in the SRPC take place when inflation expectations change or when supply shocks hit the economy - both of which shift the entire curve upward or downward rather than causing movement along it.
IB Economics Phillips Curve Diagrams - Full Visual Guide →
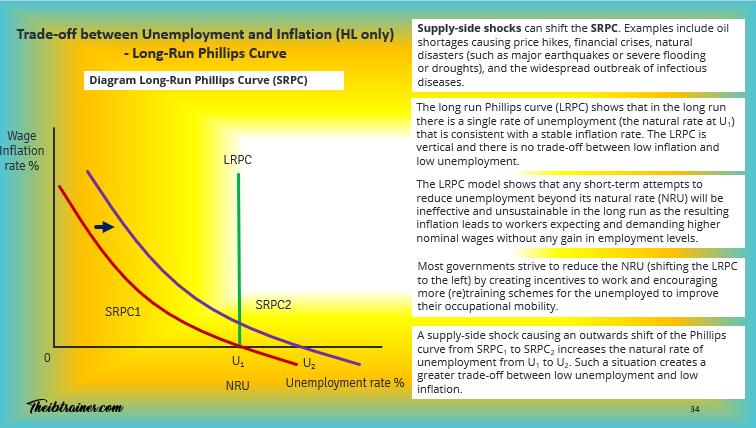
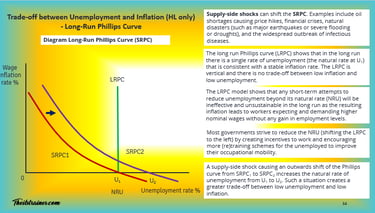
The Long-Run Phillips Curve (LRPC) and NAIRU
The Long-Run Phillips Curve (LRPC) is vertical, drawn at the Natural Rate of Unemployment (NRU) - also called the NAIRU (Non-Accelerating Inflation Rate of Unemployment).
The NAIRU is the unemployment rate consistent with stable inflation. It comprises structural unemployment (workers whose skills don't match available jobs) and frictional unemployment (workers temporarily between jobs). It does not include cyclical unemployment, which reflects demand deficiency.
The vertical LRPC claims: there is no long-run trade-off between unemployment and inflation. Attempts to keep unemployment permanently below the NAIRU through demand stimulus will simply generate accelerating inflation as workers and firms adjust their expectations upward. The economy returns to the NAIRU at a higher rate of inflation - the SRPC has shifted upward.
This is the expectations-augmented Phillips Curve, developed by Milton Friedman and Edmund Phelps in the late 1960s - before the stagflation of the 1970s appeared to confirm their predictions.
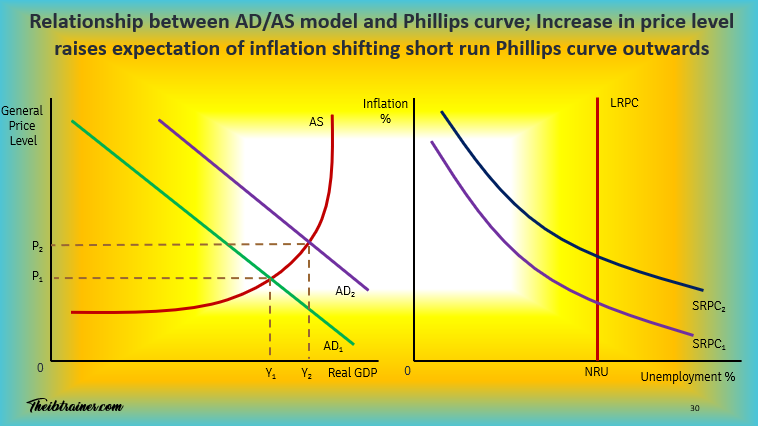
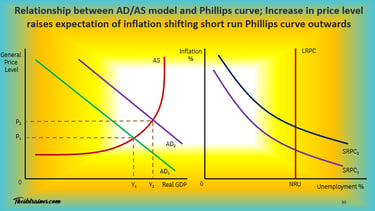
Inflation Expectations and Curve Shifts
Inflation expectations are central to modern Phillips Curve analysis. If workers expect prices to rise by 3%, they will demand 3% wage increases to protect their real wages. Firms facing higher wage costs will raise prices - and inflation of 3% results, validating the expectation.
This self-fulfilling dynamic means the SRPC shifts:
Upward when inflation expectations rise - the same level of unemployment is now associated with higher inflation
Downward when expectations fall - as happened in many economies after sustained low-inflation periods anchored expectations near central bank targets
Credibility is enormously relevant: central banks that successfully anchor inflation expectations at their target (typically 2%) keep the SRPC stable and give themselves genuine policy room to manage the unemployment-inflation trade-off.
The Stagflation Crisis: 1970s Breakdown
The Phillips Curve's greatest historical challenge came in the 1970s. The OPEC oil embargo of 1973 quadrupled oil prices, creating a severe cost-push supply shock. The result was simultaneous high inflation and high unemployment - stagflation - which the original Phillips framework said was impossible.
On the diagram, a negative supply shock shifts the SRPC upward: the economy moves to a position with both higher inflation and higher unemployment. Governments faced an impossible choice - use contractionary policy to fight inflation (worsening unemployment) or use expansionary policy to fight unemployment (worsening inflation).
The stagflation episode destroyed confidence in simple demand management and led directly to the monetarist revolution and, eventually, the inflation targeting frameworks that most central banks use today.
The Volcker Disinflation: Restoring Credibility
By the early 1980s, US inflation had reached double digits. Federal Reserve Chair Paul Volcker deliberately engineered a sharp recession by raising interest rates to 21% - accepting a deep rise in unemployment to break entrenched inflation expectations.
The strategy worked. Once households and firms believed the Fed was committed to price stability, the SRPC shifted downward - inflation fell and, eventually, so did unemployment as the economy recovered. The Volcker disinflation is the classic IB Economics example of deliberately moving down the SRPC at short-term cost to achieve a better long-run position.
The Modern Phillips Curve: Has It Flattened?
One of the most significant debates in contemporary macroeconomics is whether the Phillips Curve has flattened - meaning the trade-off between unemployment and inflation has weakened.
In the decade before the pandemic, many advanced economies experienced unemployment falling to historic lows with surprisingly little inflationary pressure - the opposite of what a steep SRPC would predict. Former Fed Chair Jerome Powell described the unemployment-inflation relationship as now "a faint heartbeat" compared to historical patterns.
Possible explanations include: better-anchored inflation expectations following decades of credible central banking; globalisation suppressing wage and price pressures; and structural changes in labour markets reducing wage bargaining power.
The post-pandemic inflation surge (2021-2023) complicated this picture - demonstrating that supply shocks can still shift the SRPC dramatically upwards even in an era of anchored expectations. The flattening debate remains unresolved and is excellent evaluation material for IB Economics extended responses.
IB Economics - Syllabus and Programme Full Guide →
The Phillips Curve in the IB Economics Exam
The Phillips Curve is an HL-weighted topic but appears across both IB Economics SL and IB Economics HL assessments:
IB Economics Paper 1 - essay questions may ask students to explain the short-run trade-off with diagrams, analyse why the LRPC is vertical, or evaluate whether governments should use demand management to reduce unemployment. The 15-mark question requires genuine evaluation: acknowledging the stagflation breakdown, the role of expectations, and the limitations of exploiting the trade-off.
IB Economics Paper 2 - data response questions may present unemployment and inflation data and ask students to apply Phillips Curve analysis.
IB Economics Paper 3 HL - extended questions often integrate the Phillips Curve with AD/AS analysis, monetary policy effectiveness, or supply-side economics.
Most common exam mistakes: treating the SRPC as fixed rather than shiftable; failing to draw both SRPC and LRPC; not explaining why the LRPC is vertical (expectations adjustment); discussing stagflation without connecting it to a supply shock.
IB Economics Aggregate Demand and Phillips Curve - Integration Guide →
IB Economics Aggregate Supply and Phillips Curve - Integration Guide →
IB Economics Monetary Policy - Full Guide →
IB Economics Diagrams Course
Master every Phillips Curve diagram - SRPC, LRPC, shifts from supply shocks, and the expectations adjustment process - fully labelled with video walkthroughs.
✔ SRPC and LRPC diagrams with full labelling
✔ Stagflation and supply shock shifts
✔ 200+ diagrams covering the full syllabus
✔ Both SL and HL clearly labelled
Frequently Asked Questions: The Phillips Curve in IB Economics
What is the Phillips Curve in IB Economics? The Phillips Curve shows the relationship between unemployment and inflation. The Short-Run Phillips Curve (SRPC) is downward-sloping, suggesting a trade-off: lower unemployment comes with higher inflation, and vice versa. The Long-Run Phillips Curve (LRPC) is vertical at the NAIRU, indicating no permanent trade-off - sustained attempts to keep unemployment below the natural rate simply generate accelerating inflation.
What is the NAIRU? The NAIRU (Non-Accelerating Inflation Rate of Unemployment) is the unemployment rate consistent with stable inflation. It includes structural and frictional unemployment but not cyclical unemployment. When actual unemployment falls below the NAIRU, inflation tends to rise; when it rises above, inflation tends to fall.
What caused the breakdown of the Phillips Curve in the 1970s? The 1973 OPEC oil shock created a massive cost-push supply shock, shifting the SRPC upward and producing stagflation - high inflation and high unemployment simultaneously. This contradicted the original Phillips framework, which only modelled demand-side influences, and led to the development of the expectations-augmented model by Friedman and Phelps.
What is the difference between movement along and a shift of the SRPC? Movement along the SRPC occurs when demand management policies change the level of aggregate demand - for example, expansionary fiscal policy moving the economy to lower unemployment and higher inflation. A shift of the SRPC occurs when inflation expectations change or a supply shock hits - the entire curve moves up or down, altering the unemployment-inflation combination at every point.
How does the Phillips Curve connect to monetary policy? Central banks use Phillips Curve analysis to set interest rates. When unemployment is below the NAIRU and inflation is rising, they raise rates to cool demand - moving along the SRPC toward lower inflation and higher unemployment. Credible inflation targeting anchors expectations and keeps the SRPC stable, giving central banks more effective policy room.
Complete IB Economics Activity Book:
52 Complete Units including the Phillips Curve
Every unit from all four modules: Every topic. Every concept. Every theory. Nothing left out.
900+ Practice Activities
Complete IB Standard Model Answers
IB Standard Marking Schemes
Exam Practice Questions
Always Updated The Living Resource Advantage
Historical Breaking Points
1970s Stagflation - Phillips Curve Breakdown
The period when the United States experienced high unemployment and high inflation simultaneously between 1973-1975, directly contradicting Phillips Curve predictions.
OPEC Oil Crisis - Supply Shock Impact
How OPEC's 1973 oil embargo quadrupled oil prices and created the supply shock that broke the Phillips relationship.
Volcker Recession - Breaking Inflation Expectations
How Fed Chairman Paul Volcker's dramatic interest rate increases to 21% in 1981 restored Phillips Curve credibility.
Germany Hyperinflation vs UK Stability - Contrasting Cases
Comparing different historical experiences with inflation and unemployment relationships across major economies.
This hub is updated regularly to reflect current IB Economics syllabus requirements and macroeconomic developments.
Essential Phillips Curve Diagrams
More information about:
IB Economics your IB Economics daily guide
IB Economics Macroeconomics low inflation is one of the main macro objectives together with sustainable economic growth, low unemployment and equitable distribution of income
IB Economics Diagrams Check Unit 19 for All Inflation, deflation and The Phillips Curve related diagrams together with explanations
IB Economics Activity book Module 3 Macroeconomics Unit 3.12 for low inflation, deflation and the Phillips Curve exam practice, activities, model answers and IB Economics Marking schemes
IB Economics Aggregate Demand and IB Economics Aggregate Supply - Direct relationship with both the AD leftward shift (malign deflation) and the SRAS rightward shift (benign deflation), revise this theory
IB Economics Fiscal Policy for exploring in depth the government priority discussion at the end of the entry - COVID furlough schemes, Venezuela policy failures - as examples of fiscal responses to inflation/unemployment trade-offs.
IB economics Calculations Book make sure you check unit 19 for low inflation, deflation and the Phillips Curve calculations exercises, calculation exam-style questions, IB model answers, and IB marking schemes
Read Next: IB Economics Fiscal Policy


© Theibtrainer.com 2012-2026. All rights reserved.
Legal
Have a Tip? Send us a tip using our anonymous form