
IB Economics Aggregate Demand Explained
Learn how aggregate demand works and drives spending in an economy with real-world examples. Macroeconomics theory & application for IB Economics students.
IB ECONOMICS MACROECONOMICSIB ECONOMICSIB ECONOMICS SLIB ECONOMICS HL
Lawrence Robert
4/22/202510 min read


Why Did You Buy That? The Economics of Aggregate Demand
Target Question:
What is aggregate demand and what are its components?
Secondary Target Question:
How do interest rates affect aggregate demand?
It's a Saturday morning in early 2025. James and her partner are sitting at the kitchen table with a cup of tea and a spreadsheet open on the laptop. They've been wanting to replace their old Lexus car for two years now. The finance deal is finally available right there - reasonable monthly payments for a brand new Toyota. But the mortgage rate went up last autumn and they're still recovering from that. Business seems a bit shaky at her partner's firm. And there's a general sense of "you know what, let's just wait and see what happens." The car stays. The dealership goes home empty-handed. And somewhere in a macroeconomics classroom, a teacher is writing on the board: "consumer confidence falls, consumption declines, AD shifts left."
In macroeconomics every single financial decision you make is part of something much bigger. Whether you buy that car, go out for dinner, or move your savings to a higher-rate account instead - it all aggregates. It all adds up. And when millions of people make similar decisions at the same time, the effect on a country's economy can be exceptional.
That's the whole point of aggregate demand. It's the big picture version of your personal spending habits. Understanding AD is absolutely central to IB Economics - and, extremely relevant to understand how the world of economics actually works around you.
What Is Aggregate Demand?
Let's start with a clean definition, because your IB Economics examiner will be looking for one.
IB Economics Definition - Aggregate Demand (AD):
Aggregate demand represents the total value of demand for all goods and services within the economy over a specific period. More precisely, it measures the planned or anticipated expenditure on domestically produced goods and services at various average price levels.
Notice that word: planned. This is a crucial distinction that confuses a lot of students, so let's clear it up right now.
Aggregate Demand vs. GDP - They Are Far From the Same Thing
This is one of those classic IB Economics mix-ups. GDP and AD look similar on the surface - both involve adding up spending in the economy - but they're actually measuring different things.
GDP is the actual expenditure value that occurred in the economy over a year. It's looking backwards at what was spent.
Aggregate Demand (AD) is the planned or anticipated expenditure for the same period. It's forward-looking - what people and firms and governments intend to spend at a given price level.
Or if we put it in more simple terms, GDP is your bank statement. AD is your budget. One records what happened; the other represents what you were planning.
IB Economics GDP GNI & The Circular Flow - Full Guide →
The AD Curve - Why Does It Slope Downwards?
When you draw the AD curve in your IB Economics diagrams - and you will draw it many, many times - it slopes downwards from left to right. This tells you something important: as the average price level in the economy rises, aggregate demand falls. As prices rise, people can afford to buy less. Their real purchasing power drops, so planned spending declines.
IB Economics Diagrams Note: When drawing AD-AS diagrams, always label the y-axis as 'Average Price Level' or 'General Price Level' - NOT 'Price' (that's for microeconomics). Label the x-axis as 'Real GDP' or 'National Output'. Getting this wrong is an easy mark to lose. Don't do it. Source visit: IB Economics Diagrams
The Formula That Will Follow You Through IB Economics
Aggregate demand has four components. Together, they make up one of the most important formulas in macroeconomics:
AD = C + I + G + (X – M)
Let's break down what each letter actually means - not just the textbook definition, but let's look at what each letter looks like in real life.
For access to all IB Economics exam practice questions, model answers, IB Economics complete diagrams together with full explanations, and detailed assessment criteria, explore the Complete IB Economics Course
C Consumption - The Key One
Consumption is the total expenditure by households on domestically produced goods and services. Consumption is the largest single component of aggregate demand. In most developed economies, it accounts for around 60–70% of total AD. When households stop spending - or start saving instead - it hits the economy hard.
Back to Jamie's story. The decision to hold off on that car purchase is a consumption decision. Multiply it across millions of households, and you've got a significant leftward shift in the AD curve.
IB Economics Real-life Example UK Consumer Spending, 2025:
Despite real wages rising for nearly two years by mid-2025, UK consumer confidence remained remarkably low. The UK household saving ratio hit 10.8% in Q2 2025 - the highest level since 2015 (excluding the pandemic). More than half of UK households reported still cutting back spending and trying to save more. The Bank of England's November 2025 Monetary Policy Report described household consumption growth as "subdued" - growing just 0.1% in Q2 2025. The lingering psychological impact of years of high inflation had made consumers price-sensitive and cautious, even as conditions improved. A classic example of how consumer confidence can hold back C - and therefore AD - long after the underlying economic numbers improve.
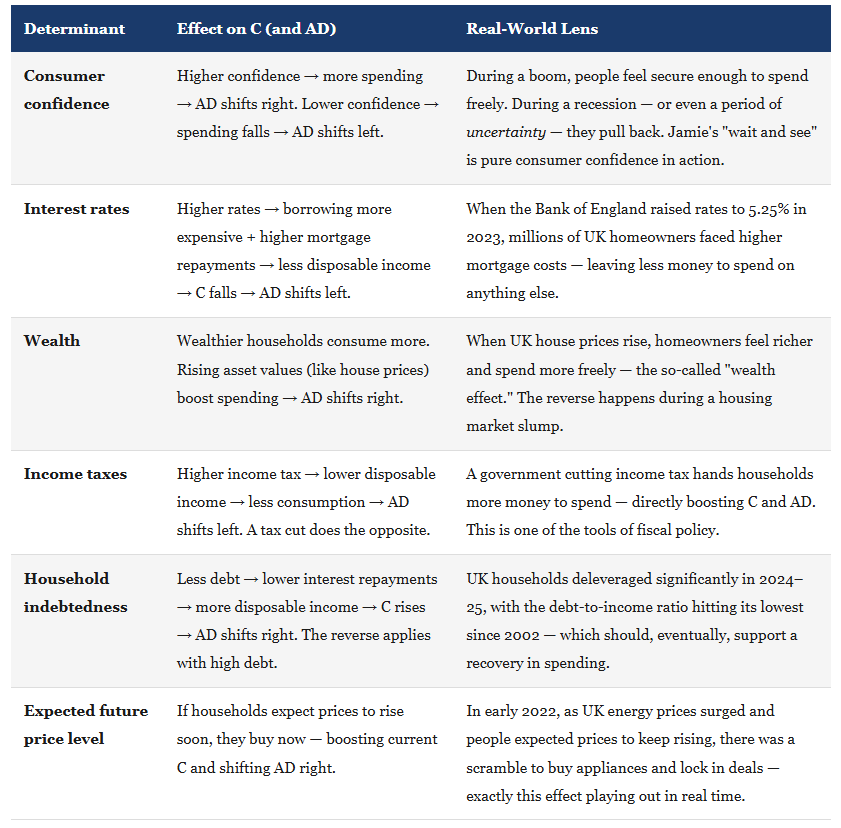
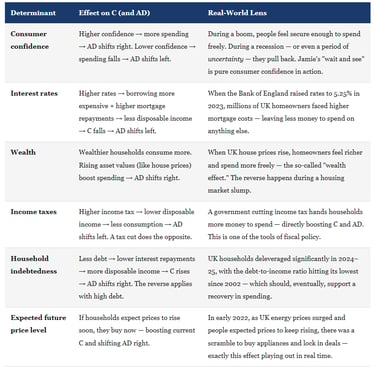
What Determines Whether People Spend or Save?
Six main factors shift consumption, and by extension, the whole AD curve:
Every episode of Pint-Sized links back to what matters most for your IB Economics course:
Understanding key IB Economics concepts
Applying them in real-world IB Economics contexts
Building IB Economics course confidence without drowning in dry theory.
Subscribe for free to exclusive episodes designed to boost your IB Economics grades and confidence
I Investment - Firms Betting on the Future
Investment (in economics, always with a capital I) refers to spending by firms on capital goods - machinery, tools, equipment, commercial vehicles, factories, offices - anything that increases a firm's productive capacity. This is not the same as putting money in a stocks and shares ISA. That's financial investment. Economic investment means building the capacity to produce more.
For instance a logistics company buying a new fleet of electric vans. Or a tech start-up building out a data centre. Or a bakery investing in a second oven to meet demand. These are all Investment expenditure - and they all feed into AD.
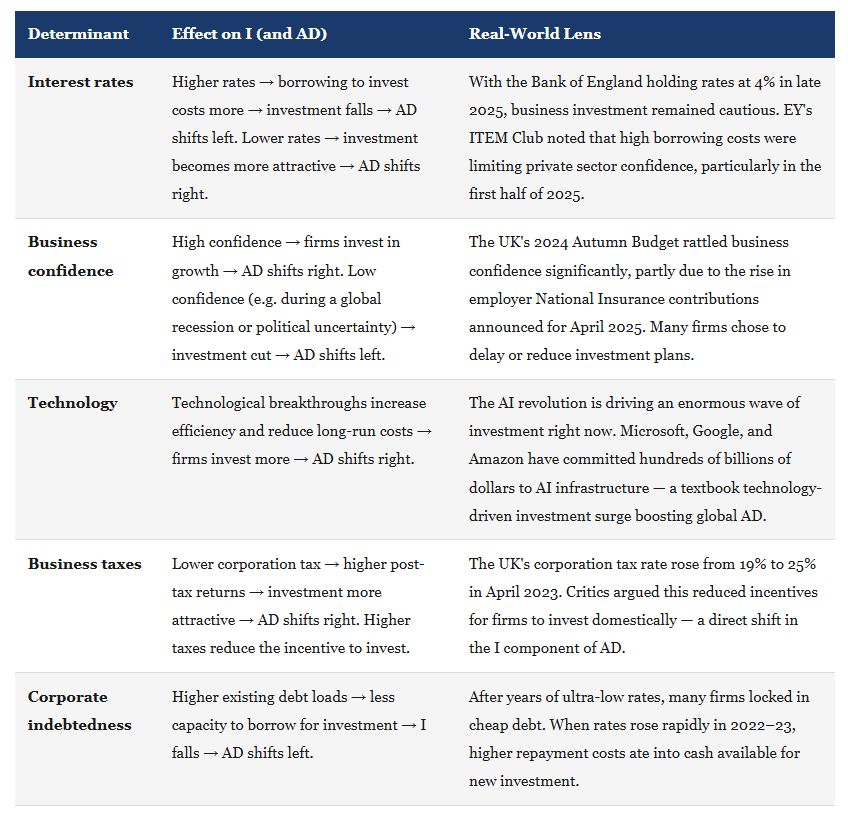
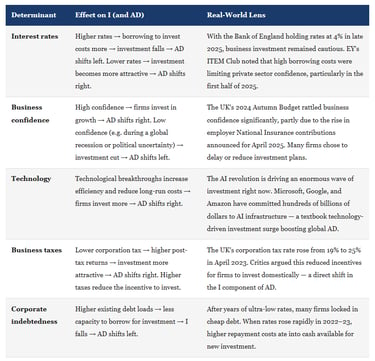
What Makes Firms Invest (or Not)?
IB Economics Diagrams Programme, What's included:
200+ exam-ready diagrams covering the entire IB Economics syllabus
Video for every diagram showing you exactly how each model looks
Image version perfect for modelling diagrams in you essays, presentations, and your IA
Detailed written explanations of the IB Economics theory behind each diagram
Both SL and HL IB Economics diagrams clearly labelled and organised by topic
Real IB Economics exam application showing how to use diagrams effectively in Paper 1 and Paper 2
G Government Spending - The State
Government spending (G) covers all public sector expenditure on goods and services: hospitals, schools, military, infrastructure, social welfare, and more. Here it's worth mentioning one important IB Economics specification point: transfer payments (like pensions and unemployment benefits) are NOT included in G - these don't represent spending on goods or services but rather a redistribution of income. Your AD diagram represents actual government purchases, not transfers.
Government spending is driven by two broad forces:
Political priorities - a government facing high unemployment may ramp up welfare spending and public works. A newly elected government may prioritise different sectors depending on its ideology and manifesto pledges.
Economic priorities - when the economy is in crisis, governments often step in as the main spender to generate economic activity.
IB Economics Real-life Example COVID-19 and Government Spending: When coronavirus brought the global economy to a near-standstill in 2020, governments around the world dramatically increased G. The UK government spent over £400 billion in 2020–21 - funding the furlough scheme, NHS expansion, vaccine rollout, and business support grants. This massive injection of G kept aggregate demand from collapsing entirely. Without it, the AD curve would have shifted totally to the left. The 2008 global financial crisis tells a similar story: governments across the US and Europe deployed enormous stimulus packages to prop up AD when both C and I collapsed simultaneously.
As UK government borrowing hit record levels by 2025, fiscal headroom became extremely tight. With borrowing in 2025/26 running £17.2 billion above OBR forecasts, the government had very little room to boost G further - meaning the G component of AD was being constrained precisely when it might have helped.
IB Economics - Syllabus and Programme Full Guide →
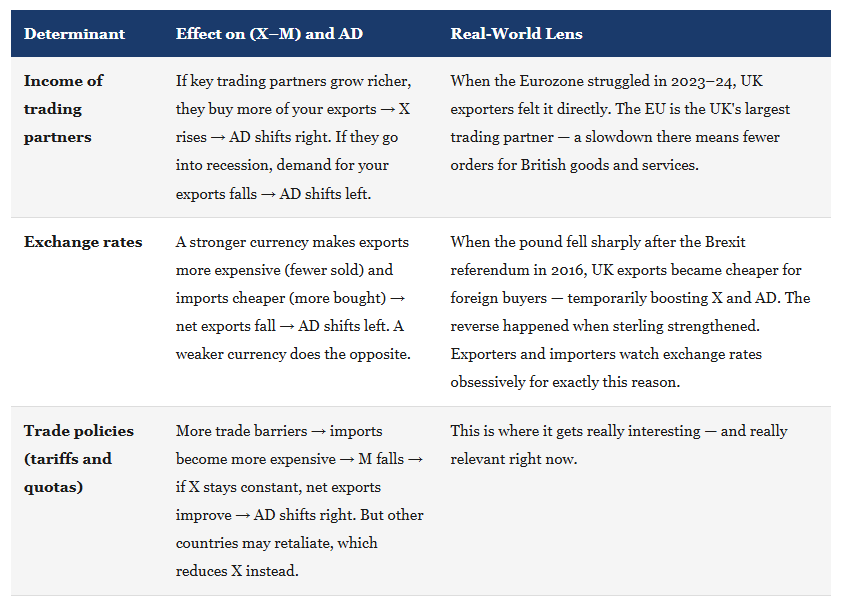
X–M Net Exports - The World as a Market
The final component is net exports: the difference between what a country earns from selling goods and services abroad (exports, X) and what it spends on buying goods and services from abroad (imports, M).
If X > M: net exports are positive, which adds to AD - the economy is selling more than it's buying from the rest of the world.
If M > X: net exports are negative, which reduces AD - the economy is buying more than it's selling. Imports represent a leakage from the circular flow of income.
What Shifts Net Exports?
IB Economics Real-life Example:
Trump Tariffs 2025 (A Masterclass in Trade Policy and AD): In 2025, the US under President Trump imposed sweeping tariffs on imports from most of its trading partners - raising the average effective tariff rate to its highest level since 1947. The stated aim was to boost American manufacturing by making imports more expensive (reducing M) and making domestic goods more competitive. In theory, this should boost net exports and AD. But trading partners retaliated. US exporters faced counter-tariffs. The WTO estimated world merchandise trade volume could fall by 0.2% in 2025, with North American exports forecast to drop by 12.6%. The US goods trade deficit actually rose in 2025 despite the tariffs - a reminder that trade policy's effects on net exports are rarely as simple as the theory suggests. For IB Economics students, this is a perfect illustration of how shifts in (X–M) can ripple through the entire global AD picture - and how unintended consequences complicate even the most confident-sounding policies.
IB Economics Summary
So what does all this mean for your AD diagram? Here's the key rule:
Movement along the AD curve: caused by a change in the average price level. Prices rise → you move up the curve (lower real output demanded). Prices fall → you move down the curve (higher real output demanded).
Shift of the AD curve: caused by a change in any determinant of C, I, G, or (X–M). If total planned spending increases for any reason, the whole AD curve shifts right (outwards). If planned spending falls, it shifts left (inwards). Source visit: IB Economics Diagrams
IB Economics Exam Tip - The Golden Rule for AD Shifts:
Any factor that increases planned spending on domestic goods and services shifts AD to the right. Any factor that reduces it shifts AD to the left. When writing your essays, always identify which component of AD is being affected (C, I, G, or X–M) and explain the chain of reasoning that leads to the shift. IB Economics Examiners love a clear chain: "An increase in interest rates increases the cost of borrowing → household consumption falls (C↓) → aggregate demand decreases → the AD curve shifts to the left, ceteris paribus."
And that word - ceteris paribus - often implies a lot of assumptions. In reality, all four components are shifting simultaneously, in different directions, all the time. That's what makes macroeconomics both fascinating and genuinely difficult.
Jamie decided not to buy the car (C falls). Her partner's firm delayed a new equipment order (I falls). But the government just announced infrastructure spending (G rises). And a newly signed UK-US trade deal is boosting exports (X rises). The net effect on AD? It depends on the relative sizes of each movement - which is exactly why economists argue about this stuff for a living.
Frequently Asked Questions: Aggregate Demand (IB Economics)
What is aggregate demand in economics?
Aggregate demand (AD) is the total planned expenditure on domestically produced goods and services in an economy over a specific period, at various average price levels. It is calculated using the formula AD = C + I + G + (X – M), where C is consumption, I is investment, G is government spending, and (X – M) is net exports. The AD curve slopes downward: as the general price level rises, aggregate demand falls.
What are the four components of aggregate demand?
The four components are:
(1) Consumption (C) - household spending on goods and services, the largest component;
(2) Investment (I) - firm spending on capital goods like machinery and buildings;
(3) Government spending (G) - public sector expenditure on goods and services, excluding transfer payments; and
(4) Net Exports (X–M) - the difference between export earnings and import expenditure.
How do interest rates affect aggregate demand?
Interest rates affect both consumption (C) and investment (I). Higher interest rates make borrowing more expensive for households - reducing disposable income and discouraging spending on credit. They also raise borrowing costs for firms, reducing investment in capital goods. Both effects shift the AD curve to the left, reducing aggregate demand. Lower interest rates have the opposite effect, stimulating both C and I and shifting AD to the right.
What is the difference between a movement along the AD curve and a shift of the AD curve?
A movement along the AD curve occurs when the average price level changes - higher prices reduce the quantity of real output demanded, and lower prices increase it. A shift of the entire AD curve occurs when any determinant of the four components changes (e.g. consumer confidence rises, interest rates fall, government increases spending, or trade policies change). A rightward shift means higher planned spending at every price level; a leftward shift means lower planned spending.
What is the difference between aggregate demand and GDP?
GDP measures actual expenditure in the economy over a given period - it is a record of what was spent. Aggregate demand measures planned or anticipated expenditure at various price levels - it is forward-looking. While the formula is similar (both use C + I + G + (X–M)), GDP captures realised transactions whereas AD represents intended spending decisions at different price levels.
Coming next Aggregate Supply - why some economies can’t just “produce more” even if demand is booming and it’s not as easy as turning up the factory dial.
Stay well,
Related Topics:
IB Economics your IB Economics daily content guide
IB Economics Macroeconomics for exploring all IB Economics macroeconomics content including aggregate demand
IB Economics Diagrams all IB Economics Aggregate Demand Diagrams and Graphs are here, learn them
IB Economics The Keynesian vs. Monetarist These schools of thought differ on how an increase in Aggregate Demand AD affects the economy, particularly whether it leads to real economic growth or merely inflation. Explore and learn this key IB Economics content.
Governments and central banks actively manipulate Aggregate demand AD to stabilise the economy using two main policies:
IB Economics Fiscal Policy Manipulating taxation and government spending to shift AD.
IB Economics Monetary Policy Controlling interest rates and the money supply to influence consumer borrowing and business investment.
IB Economics Paper 1 explore this paper for possible Aggregate Demand AD questions
IB Economics Activity book Module 3 Macroeconomics Unit 3.5 Aggregate Demand exam practice, activities, model answers and IB Marking schemes
IB Economics Macroeconomic Equilibrium Managing Aggregate Demand AD is central to achieving price stability, full employment, and sustainable economic growth.
IB Economics Exchange rate as exchange rates are directly related to net exports and Aggregate Demand
IB Economics Quotas for revising the effect of quotas on trade and net exports
IB Economics Calculations Book Access Unit 16 for practicing Aggregate Demand and Aggregate Supply calculations
Read Next: IB Economics Aggregate Supply
© Theibtrainer.com 2012-2026. All rights reserved.
Legal
Have a Tip? Send us a tip using our anonymous form