
Macroeconomics
Target Question:
What does IB Economics macroeconomics cover and what are the key topics?
Your complete guide to the IB Economics macroeconomics module - what it covers, how the topics connect, key diagrams, and links to every topic page.
Full macroeconomics activity practice breakdown, exam practice, model answers and evaluation tools are available exclusively in the IB Economics Activity Book and IB Economics Calculations book.
What Is Macroeconomics?
Macroeconomics: is the study of the economy as a whole - how national output is measured, why economies fluctuate between boom and recession, what causes unemployment and inflation, and how governments use fiscal, monetary, and supply-side policies to pursue economic objectives.
It is the most policy-focused section of the IB Economics course. Microeconomics analyses individual markets and firms and macroeconomics analyses the aggregate performance of entire economies and the policy debates that shape them.
IB Economics definition:
Macroeconomics examines the behaviour of the economy at the national level - measuring and explaining fluctuations in real GDP, unemployment, inflation, and government finances, and evaluating demand-side and supply-side policies designed to achieve the four key macroeconomic objectives: economic growth, low unemployment, low and stable inflation, and (HL) sustainable government debt.
Macroeconomics is designed to be taught for approximately 35-40 hours at SL and 45-50 hours at HL, making it the largest single module in the course. The additional HL content includes sustainable government debt as a fourth objective, the Phillips Curve and the monetarist model, and more advanced policy evaluation.
The Four Macroeconomic Objectives
IB Economics organises macroeconomic analysis around four key objectives that governments pursue - and which frequently conflict with each other and generate trade-offs.
Economic growth - sustained increases in real GDP over time, enabling higher living standards, job creation, and tax revenues for public services. Growth is both a short-run objective (closing negative output gaps) and a long-run objective (shifting LRAS rightward through investment, human capital, and technology).
Low unemployment - maintaining employment at or near the natural rate (typically 4-5% in advanced economies), where only frictional and structural unemployment remain. Cyclical unemployment - the preventable kind - is the primary target of demand management policy.
Low and stable inflation - most central banks target 2% annual inflation as the foundation for investment planning, savings protection, and international competitiveness. Both excessive inflation and deflation carry significant economic costs.
Sustainable government debt (HL) - managing budget deficits and accumulated debt so that debt servicing costs do not crowd out productive spending or undermine market confidence. The sustainability of any given debt level depends on the relationship between the interest rate and the growth rate of the economy.
The AD-AS Model: The Central System
The Aggregate Demand and Aggregate Supply (AD-AS) model is the analytical foundation of the entire macroeconomics unit. Every policy topic - fiscal policy, monetary policy, supply-side policy - is analysed through their impact following this model.
Aggregate Demand (AD): AD = C + I + G + (X-M). The AD curve slopes downward - at lower price levels, real purchasing power is higher, interest rates tend to be lower, and exports are more competitive. Demand shocks (changes in confidence, government spending, interest rates, exchange rates) shift the AD curve left or right.
Short-Run Aggregate Supply (SRAS): slopes upward - higher prices make production more profitable in the short run. Supply shocks (oil price changes, natural disasters, productivity changes) shift the SRAS curve.
Long-Run Aggregate Supply (LRAS): vertical at the full employment level of output - the economy's productive capacity. LRAS shifts rightward with economic growth (more or better resources, improved technology). It does not shift with demand changes.
Output gaps: when actual GDP falls short of potential GDP (actual < LRAS), a negative output gap (deflationary gap) exists - spare capacity and unemployment above the natural rate. When actual GDP exceeds potential, a positive output gap (inflationary gap) exists - overheating and inflationary pressure.
The AD-AS model explains every major macroeconomic event: the 2020 COVID recession (sharp leftward AD and SRAS shifts), the 2021-23 inflation surge (rightward AD shift combined with leftward SRAS shift from supply disruptions), and the subsequent monetary tightening (deliberate leftward AD shift through interest rate rises).
Module 3: Macroeconomics
3.1 Measuring economic activity and illustrating its variations
3.2 Variations in economic activity - aggregate demand and aggregate supply
3.4 Economics of inequality and poverty
3.5 Demand management (demand-side policies) - monetary policy
3.6 Demand management - fiscal policy
Unit-by-Unit Summary
Unit 1 - Measuring Economic Activity
GDP (Gross Domestic Product) measures the total value of final goods and services produced within a country's borders. Real GDP adjusts for inflation; nominal GDP uses current prices. GNI (Gross National Income) adds net income from abroad - a better measure of a nation's total income for countries with significant overseas investment.
The business cycle describes alternating expansion and contraction phases. Output gaps measure the difference between actual and potential GDP. GDP has significant limitations as a welfare measure - it ignores non-market production, environmental degradation, income distribution, and quality of life. Alternative measures including the HDI and Genuine Progress Indicator attempt to capture broader well-being.
IB Economics Business Cycle - Full Guide →
IB Economics Economic Growth - Full Guide →
Unit 2 - AD-AS Analysis
Comprehensive AD-AS model analysis - components of aggregate demand, determinants of shifts in AD and SRAS, the vertical LRAS, and how demand and supply shocks produce different combinations of output and price level changes. The 2021-23 inflation episode - combining demand-side stimulus with supply-side disruptions - is a typical case study of simultaneous AD and SRAS shifts.
IB Economics AD-AS Model - Full Guide →
Unit 3 - Economic Growth
Long-run economic growth - the sustained rightward shift of LRAS - requires capital accumulation, labour force expansion and quality improvement, technological progress, and strong institutions. Growth has significant costs alongside its benefits: opportunity costs of investment, environmental degradation, and unequal distribution of gains. Contemporary debates about whether long-term growth is compatible with environmental sustainability are directly relevant to IB Economics evaluation.
IB Economics Economic Growth - Full Guide →
Unit 4 - Low Unemployment
Four different types of unemployment (frictional, structural, seasonal, cyclical) require different policy responses. The natural rate of unemployment (NRU/NAIRU) - comprising frictional and structural unemployment - is the target for supply-side policy. Cyclical unemployment, caused by insufficient aggregate demand, is the target for demand management. Okun's Law provides the empirical link between output gaps and unemployment rates.
IB Economics Unemployment - Full Guide →
Unit 5 - Low and Stable Inflation
Demand-pull inflation (AD > SRAS at full employment) and cost-push inflation (SRAS shifts leftward) require different policy responses. The CPI measures inflation through a weighted basket of goods. Deflation - persistent price falls - is potentially more damaging than moderate inflation, as Japan's experience from the 1990s demonstrates. The wage-price spiral illustrates how inflation can become self-reinforcing through expectations.
IB Economics Inflation - Full Guide →
Unit 6 - Sustainable Government Debt (HL)
Government debt sustainability depends on the relationship between the interest rate (r) and economic growth rate (g). When g > r, debt-to-GDP ratios can fall even with ongoing deficits. When r > g, debt dynamics become self-reinforcing. The post-pandemic surge in advanced economy debt (averaging 120% of GDP) combined with rising interest rates has made this analysis extremely relevant. Crowding out - government borrowing competing with private investment for funds - is the key mechanism linking high debt to slower long-run growth.
IB Economics Fiscal Policy - Full Guide →
Unit 7 - Policy Conflicts and Trade-offs
The Phillips Curve models the short-run trade-off between unemployment and inflation. The Long-Run Phillips Curve is vertical at the natural rate - when expectations are increased in the HL model, it shows there is no permanent trade-off. Stagflation (simultaneously high inflation and unemployment) arises from supply shocks shifting the SRPC upward, creating a policy dilemma.
Other key conflicts: growth vs price stability, reducing debt vs supporting growth, environmental sustainability vs output expansion, and equity vs efficiency.
IB Economics Phillips Curve - Full Guide →
Unit 8 - Inequality and Poverty
The Gini coefficient and Lorenz curve measure income inequality. The HDI measures development across health, education, and income. Absolute poverty (below a subsistence threshold) is primarily a development economics concern; relative poverty (below 60% of median income) persists even in wealthy countries. The policy toolkit - progressive taxation, transfer payments, minimum wages, education investment - involves genuine equity-efficiency trade-offs.
IB Economics Inequality - Full Guide →
IB Economics Poverty - Full Guide →
Unit 9 - Monetary Policy
Central banks use interest rates as the primary demand management tool - raising rates shifts AD leftward (contractionary) by increasing borrowing costs; cutting rates shifts AD rightward (expansionary). The transmission mechanism operates through multiple channels: interest rates, credit availability, asset prices, exchange rates, and expectations. Quantitative easing (QE) provides additional stimulus when the zero lower bound is reached. Central bank independence manages inflation expectations.
IB Economics Monetary Policy - Full Guide →
Unit 10 - Fiscal Policy
Expansionary fiscal policy (increasing G or cutting taxes) shifts AD rightward; contractionary (cutting G or raising taxes) shifts it leftward. Automatic stabilisers (progressive taxes, unemployment benefits) moderate cycles without having to apply additional measures. The Keynesian multiplier amplifies initial spending changes. Key limitations include time lags, crowding out, and the political difficulty of fiscal consolidation.
IB Economics Fiscal Policy - Full Guide →
Unit 11 - Supply-Side Policies
Supply-side policies shift LRAS rightward - increasing the economy's productive capacity without generating inflation. Market-based policies (deregulation, tax cuts, privatisation) work through incentive mechanisms; interventionist policies (education investment, R&D support, infrastructure) address market failures directly. Both have roles; both have limitations. Supply-side policies work slowly but offer the only sustainable path to long-run growth.
IB Economics The Goals of Supply-Side Policies - Full Guide →
IB Economics Supply-Side Policies effect on demand - Full Guide →
The Nine Key Concepts in Macroeconomics
The IB Economics course requires students to analyse macroeconomic issues through the lens of the nine key concepts. Their most direct use in macroeconomics is:
Scarcity and choice - policy instruments are scarce. A central bank that uses interest rates to control inflation cannot simultaneously use them to stimulate growth. Every policy choice involves an opportunity cost.
Efficiency and equity - macroeconomic policies involve persistent trade-offs between allocative efficiency and equitable distribution. Progressive taxation and redistribution may reduce efficiency incentives; high inequality itself reduces efficiency through various channels.
Economic well-being - the four macroeconomic objectives directly target components of well-being: employment maintains income and dignity; price stability protects purchasing power; growth enables higher living standards.
Sustainability - government debt sustainability constrains fiscal policy; environmental sustainability constrains the growth model. Both involve intergenerational trade-offs.
Interdependence - macroeconomic policies in major economies spill over internationally through exchange rates, trade flows, and capital movements. A US interest rate rise affects borrowing costs in developing countries.
Intervention - the entire macroeconomics unit evaluates government intervention in the economy - when it works, when it fails, and what the trade-offs are.
IB Economics - Syllabus and Programme Full Guide →
IB Economics Macroeconomics Required Diagrams
This is not an exhaustive list, these are the absolute Minimum requirements:
Measuring Economic Activity (Section 3.1)
Circular flow of income model showing decision makers, leakages, and injections
Business cycle showing short-term fluctuations and long-term growth trend (potential output)
Aggregate Demand and Supply (Section 3.2)
Aggregate demand (AD) curve and shifts of AD
Short run aggregate supply (SRAS) curve and shifts of SRAS
Alternative views of AS curve
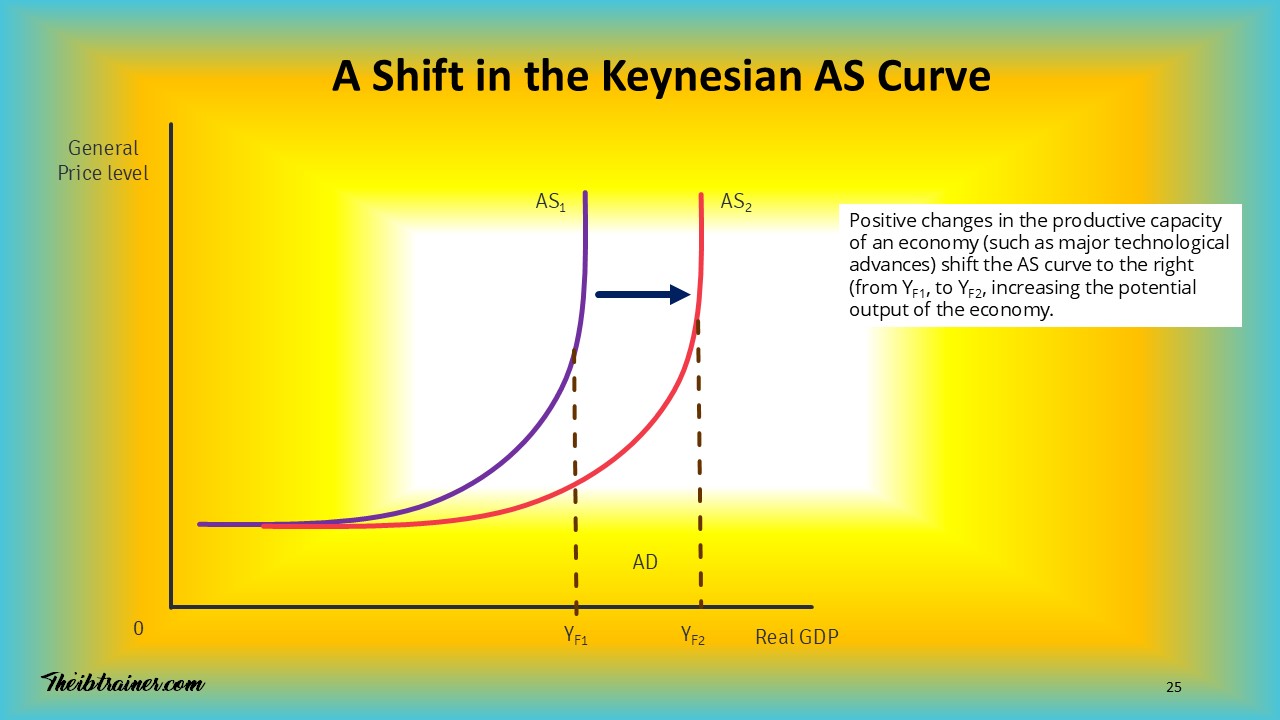
Shifts of long run aggregate supply (LRAS) or Keynesian AS curve
Macroeconomic equilibrium in short run and long run
Macroeconomic Objectives (Section 3.3)
Economic Growth:
PPC showing actual growth and growth in production possibilities
AD increases showing increases in real output
LRAS increases showing increases in full employment output
Unemployment:
Minimum wage showing unemployment
Fall in demand for labour in particular market or geographical area
Deflationary gap showing cyclical unemployment
Inflation and Deflation:
Demand-pull inflation
Cost-push inflation
Deflation
Trade-offs:
AD/AS curves showing trade-off between unemployment and inflation
Phillips curve showing short-run and long-run relationship between inflation and unemployment
Inequality and Poverty (Section 3.4)
Lorenz curve showing income distribution and changes in distribution
Construction of Lorenz curve from income quintile data
Monetary Policy (Section 3.5)
Determination of equilibrium interest rates (demand and supply of money)
AD/AS curves showing expansionary and contractionary monetary policy
Fiscal Policy (Section 3.6)
AD/AS curves showing expansionary and contractionary fiscal policy for both Keynesian and monetarist/new classical schools
Crowding-out effect (constraints on fiscal policy)
Supply-Side Policies (Section 3.7)
AD/AS model and LRAS curve showing effect of supply-side policies
Minimum wage (abolishing minimum wage as market-based supply-side policy)
Key Macroeconomics Diagrams
The following diagrams are directly examined across Papers 1, 2, and 3 (HL). Every one must be drawn accurately with full labelling:
AD-AS model - showing expansionary and contractionary demand shocks, supply shocks, and short-run vs long-run adjustment
Business cycle diagram - with trend growth line, output gap, and all four phases labelled
Short-run and long-run Phillips Curve - including expectations adjustment and stagflation (HL)
Fiscal multiplier illustration in AD-AS context
Lorenz curve and Gini coefficient
IB Economics Diagrams Course - Full Guide →
IB Economics Diagrams Course
Every macroeconomics diagram you need - AD-AS, business cycle, Phillips Curve, output gap, fiscal and monetary policy effects - fully labelled with video walkthroughs.
✔ All macroeconomics SL and HL diagrams
✔ Video for every diagram with exam application
✔ Short-run vs long-run analysis clearly distinguished
Frequently Asked Questions: IB Economics Macroeconomics
What does IB Economics macroeconomics cover? The macroeconomics unit covers eleven topics: measuring economic activity (GDP, business cycle, output gaps); the AD-AS model; economic growth; unemployment; inflation; sustainable government debt (HL); policy conflicts and trade-offs; inequality and poverty; monetary policy; fiscal policy; and supply-side policies. It is organised around four key macroeconomic objectives - growth, low unemployment, price stability, and sustainable debt - and evaluates the policy tools governments use to pursue them.
What is the AD-AS model in IB Economics? The AD-AS model shows how aggregate demand (total planned spending: C+I+G+(X-M)) and aggregate supply (total planned production) interact to determine the economy's price level and real output. Demand shocks shift the AD curve; supply shocks shift the SRAS or LRAS curves. The model is used to analyse every macroeconomic policy tool and explains how fiscal stimulus, monetary tightening, and supply-side reforms affect the economy.
What are the four macroeconomic objectives in IB Economics? The four objectives are: economic growth (sustained increases in real GDP); low unemployment (maintaining employment near the natural rate); low and stable inflation (typically targeting 2%); and sustainable government debt (HL only - managing debt-to-GDP ratios so servicing costs do not crowd out productive spending). These objectives frequently conflict, requiring policy trade-offs - the Phillips Curve trade-off between inflation and unemployment is the most commonly examined.
What is the difference between demand-side and supply-side policy? Demand-side policies (fiscal and monetary) manage aggregate demand - shifting the AD curve to close output gaps in the short run. Supply-side policies improve the economy's productive capacity - shifting the LRAS curve rightward to enable higher output without inflation in the long run. Demand-side policies work quickly but cannot solve structural problems; supply-side policies address root causes but take years to affect output.
How does the Phillips Curve relate to macroeconomic policy? The Short-Run Phillips Curve (SRPC) shows the trade-off between unemployment and inflation: expansionary policy reduces unemployment but increases inflation; contractionary policy reduces inflation but increases unemployment. The Long-Run Phillips Curve (LRPC, HL) is vertical at the natural rate - exploiting the short-run trade-off through sustained demand stimulus only generates accelerating inflation once expectations adjust. Stagflation (1970s oil shocks) demonstrated that supply shocks can shift the SRPC upward, creating both high inflation and high unemployment simultaneously.
This hub is updated regularly to reflect current IB Economics macroeconomics syllabus requirements.
Explore Topics:
IB Economics your IB Economics daily guide
IB Economics Diagrams Check this resource for All the IB Economics macroeconomics diagrams with explanations
IB Economics Activity book More IB Economics macroeconomics exam practice, activities, model answers and IB Economics Marking schemes, all units all modules covered
IB Economics Required Diagrams SL HL This is a list of the required diagrams for IB Economics
IB Economics Calculations SL HL This is a list of the different calculations required for IB Economics
IB economics Calculations Book 25 units of calculations exercises for SL and HL, find your macroeconomics calculations here with IB model answers, and IB marking schemes
IB Economics Paper 1 all the information you need to understand your paper 1 exam and to practice macroeconomics questions
IB Economics Paper 2 all the information you need to understand your paper 2 exam and to practice macroeconomics questions
IB Economics Paper 3 HL for paper 3 practice and macroeconomics questions
Read Next: IB Economics Microeconomics
© Theibtrainer.com 2012-2026. All rights reserved.
Legal
Have a Tip? Send us a tip using our anonymous form