
IB Economics Inequality Equality and Equity
Explore economic inequality, equity vs equality, Lorenz curves and Gini coefficients with real-world examples and laughs along the way. Master IB Economics.
IB ECONOMICS HLIB ECONOMICS SLIB ECONOMICSIB ECONOMICS MACROECONOMICS
Lawrence Robert
4/27/20259 min read


Rich List vs The Rest: The Economics of Inequality
Target Question
How is income inequality measured in IB Economics?
Every year, the Sunday Times publishes its Rich List - a glossy rundown of Britain's wealthiest individuals. In 2024, the top spot belonged to a family with a fortune worth £37 billion. Meanwhile, according to the House of Commons Library, the lowest-income 10% of UK households were living on just £235 a week in 2023/24 - falling from £253 a week the year before.
Two sets of people living in the same country. Two completely different economic universes.
In reality this is not only morally uncomfortable, or unethical. But the fact is that inequality shapes everything: how fast economies grow, how stable societies are, how much governments can actually do to achieve their policies and their goals.
Let's go for it.
First Up: Equality vs Equity
Similar sounding terms, but in economics they mean very different things.
Equality is simple: everyone gets the same. If you divided the entire UK's national income equally among every person, and nobody earned more or less than anyone else, you'd have perfect income equality. No differences. Perfect parity.
IB Economics definition - Equality:
The equal distribution of income across all individuals, such that no income gap exists between individuals.
Equity is about fairness, not sameness. An equitable system recognises that some people should earn more - because they've spent years training, developing rare skills, or taking on greater responsibility. A surgeon who spent a decade in medical school being paid more than someone stacking shelves at Tesco isn't unfair - it reflects the investment, skill, and responsibility involved. That's a justified inequality. That's equity.
IB Economics definition - Equity:
Economic fairness in the distribution of income and wealth; the idea that inequalities should be justified by differences in skill, effort, training, and responsibility - not by inherited privilege or discrimination.
A perfectly equal society isn't necessarily equitable, and an equitable society will always have some income inequality. The debate in economics isn't whether inequality should exist at all - it's about how much inequality is acceptable, and what promotes inequality to the extent it becomes unjustifiably large.
Income vs Wealth: Two Different Things, Same Problem
Before we go further, let's cover another crucial distinction that when under test or time pressure, may cause some students to be confused.
IB Economics definition - Income:
Is a flow. It's money coming in: your wages each month, a salary, benefits, rental income. It arrives regularly, you spend most of it, and the flow can stop if you lose your source of income (for most people the main source of income is their job).
IB Economics definition - Income inequality:
The unequal distribution of income across a population, where a minority of individuals or households earn a disproportionately large share of total national income.
IB Economics definition - Wealth:
Is a stock. It's the accumulation of everything you own that has monetary value: property, savings, shares, land, investment funds.
Think of wealth as water already in the tank - built up over time and retained even when the tap slows down.
IB Economics definition - wealth inequality:
The unequal distribution of accumulated assets - including property, savings, shares, and investments - across a population. Wealth inequality is typically greater than income inequality.
Wealthy households - those with property, shares, and savings - generate more income from their wealth. Their assets appreciate, pay dividends, and generate rental income. Meanwhile, low-income households often carry debt - credit cards, overdrafts, payday loans - they usually cover with their salaries, meaning they're paying out in interest rather than building anything up.
IB Economics Real-life example:
In the UK, the top fifth of households take 36% of the country's income and a staggering 63% of the country's wealth. The bottom fifth have just 8% of income - and only 0.5% of the wealth.
Wealth inequality, in other words, is far more severe than income inequality. And because wealth generates income, the two reinforce each other in a cycle that's very hard to break out of if you start at the bottom.
Internal Assessment (IA) Guide – Free Download
Step-by-step support on topic selection, structure, evaluation, and most common IB Economics IA mistakes.
Understanding key IB Economics Internal Assessment concepts
Applying and explaining them in real-world IB Economics contexts
Building IB Economics IA confidence without drowning in dry theory and explanations.
Download the IA guide now for free and boost your IB Economics grades and confidence
Why Does Inequality Exist? The Economics Answer
In a free market economy, inequality exists essentially by default. Here's why.
The factors of production - land, labour, capital, enterprise - are not equally distributed. Some people own land and property. Some have rare, highly valued skills (a Premier League footballer, a specialist surgeon, a top-flight lawyer). Some have access to capital to invest and generate returns. Others have very little of any of these if any.
Wage differentials reflect this reality. A pilot earns more than a checkout worker not because one person is more worthy as a human being, but because their skill set is rarer, their training longer, and their role harder to fill. That's the labour market at work.
The distribution of the factors of production in the real world isn't just the result of talent and hard work. It's also shaped by inherited wealth, educational access, social networks, discrimination, and geography. Income inequalities exist between regions, between genders, between ethnicities, and between age groups - and many of these gaps are very difficult to justify individually or on economic merit alone.
IB Economics - Syllabus and Programme Full Guide →
Measuring Inequality: The Lorenz Curve and the Gini Coefficient
Economics doesn't just theorise about inequality - it measures it. Two tools are essential for your IB Economics exam.
The Lorenz Curve
The Lorenz curve is a graph that plots the cumulative share of national income (on the vertical axis) against the cumulative share of the population (on the horizontal axis), divided into quintiles - that is, fifths of the population.
IB Economics definition - Lorenz curve:
A graphical tool showing the actual distribution of income or wealth across quintiles of the population, compared to the 45-degree line of perfect equality. The greater the area between the curve and the line, the greater the inequality.
IB Economics definition - Quintile:
One fifth (20%) of a population, used to divide income or wealth data into five equal groups for analysis.
If income were perfectly equally distributed, each 20% of the population would earn exactly 20% of national income. Plot that, and you get a straight diagonal line at 45 degrees - the line of perfect equality.
In reality, the bottom 20% earn far less than 20% of national income. The Lorenz curve bows below the 45-degree line. The further the curve bows away from the line of perfect equality, the greater the income inequality. The area between the line of perfect equality and the Lorenz curve is the key: a bigger gap means a more unequal society.
In the UK today, the richest fifth of the population accounts for 36% of total disposable household income, while the poorest fifth accounts for just 9%. Your Lorenz curve would bow quite far from that line of perfect equality.
The Gini Coefficient
IB Economics definition - Gini coefficient:
A statistical measure of income or wealth inequality, calculated as the ratio of the area between the Lorenz curve and the line of perfect equality to the total area under the line. Ranges from 0 (perfect equality) to 1 (perfect inequality).
The Gini coefficient puts a single number on what the Lorenz curve shows visually. It's calculated as:
Gini coefficient = A ÷ (A + B)
Where:
A is the area between the line of perfect equality and the Lorenz curve
A + B is the total area under the line of perfect equality
The result is a number between 0 (perfect equality - the Lorenz curve is the 45-degree line) and 1 (perfect inequality - one person owns everything).
In practice, expressed as a percentage, it ranges from 0% to 100%. Higher = more unequal.
The UK's Gini coefficient was 35% before housing costs and 39% after housing costs in 2023/24. After housing costs is an important distinction, because poorer households spend a far larger share of their income on rent and mortgages than wealthier ones - so housing costs amplify inequality in practice.
For international comparison:
Norway: 0.227 - one of the world's most equal countries, with a generous welfare state and strong labour protections
Slovakia and Slovenia: similarly low, around 0.23–0.24
South Africa: 0.63 - one of the most unequal countries on Earth, with deep historical roots in apartheid-era dispossession
Namibia: 0.591; Suriname: 0.579
OECD figures suggest the UK has one the highest levels of income inequality in the European Union, although income inequality is slightly lower than in the United States. Not good news for a G7 economy.
The Real-World Consequences of High Inequality
The effects of income and wealth inequality ripple through society in ways that are quite damaging.
Higher poverty rates. When income is concentrated at the top, more people at the bottom fall below the poverty line - unable to afford adequate housing, nutrition, or heating. In the UK in 2025, energy debts owed to suppliers stood at a record £4.4 billion, with more than one million households behind on their gas or electricity bills without a repayment plan. We are not just mentioning bare statistics here - they're families choosing between heating and eating.
Greater household debt. Low-income households borrow to cover basics, paying interest that further consumes their disposable income and widens the wealth gap. The debt trap is real.
Slower GDP growth. Here's the economic - not just moral - argument against extreme inequality. When lower-income households have less money, they spend less. Consumption - the largest component of aggregate demand - falls. Economic growth slows. Inequality, beyond a certain point, actually undermines the economic growth that's supposed to justify it.
Political instability. Widening inequality breeds resentment, social division, and political polarisation. Inequality is one of the most frequently mentioned drivers of the populist political movements that have reshaped democracies across Europe and North America in the last decade.
For access to all IB Economics exam practice questions, model answers, IB Economics complete diagrams together with full explanations, and detailed assessment criteria, explore the Complete IB Economics Course
But Is All Inequality Bad?
Some inequality is not just inevitable - it's economically useful. Wage differentials incentivise people to study longer, develop rarer skills, and take on greater risk and responsibility. If a surgeon earned the same as an unskilled labourer, the main incentive to go through a decade of medical training disappears. A certain degree of inequality is what makes a market economy function.
The issue isn't inequality itself - it's excessive inequality, where the gaps become so large that:
Social mobility grinds to a halt
Large portions of the population are permanently excluded from economic opportunity
The gains from growth accrue only to those already in a wealthy position
Most governments strive, therefore, not for perfect equality, but for greater equity - a system where effort and merit are rewarded fairly, inherited advantage is limited, and a robust safety net prevents the worst outcomes for those at the bottom.
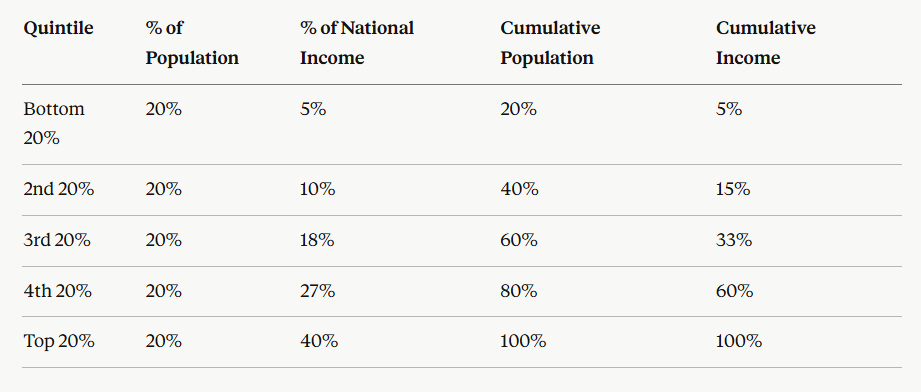
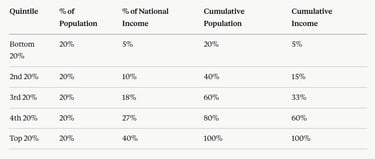
The Lorenz Curve in Numbers: An HL Quick Example
For IB Economics HL, you need to be able to construct a Lorenz curve from quintile data. Here's a simplified example:
Plot the cumulative columns on a graph with the 45-degree line, and you have your Lorenz curve. The bow beneath the line reflects the inequality in the data. The Gini coefficient is the ratio of the area of that bow to the total area under the 45-degree line. Source visit: IB Economics Diagrams
IB Economics Diagrams Programme, What's included:
200+ exam-ready diagrams covering the entire IB Economics syllabus
Video for every diagram showing you exactly how each model looks
Image version perfect for modelling diagrams in you essays, presentations, and your IA
Detailed written explanations of the IB Economics theory behind each diagram
Both SL and HL IB Economics diagrams clearly labelled and organised by topic
Real IB Economics exam application showing how to use diagrams effectively in Paper 1 and Paper 2
Frequently Asked Questions: Inequality, Equality, Equity (IB Economics)
Q: What is the difference between equality and equity in IB Economics? Equality means everyone receives the same income, with no gaps at all. Equity means fairness - some income inequality is acceptable if it reflects genuine differences in skill, training, and effort. Most governments aim for equity, not perfect equality.
Q: What is the difference between income and wealth in economics? Income is a flow - money received regularly, like wages. Wealth is a stock - assets accumulated over time, like property, savings, and shares. Wealth inequality is typically far greater than income inequality, and wealth generates additional income, making the gap harder to close.
Q: What does the Gini coefficient measure? The Gini coefficient measures income or wealth inequality in a single number between 0 and 1 (or 0–100%). A score of 0 represents perfect equality; a score of 1 represents perfect inequality. The UK's Gini coefficient is around 0.35, making it one of the more unequal advanced economies in Europe.
Q: What does the Lorenz curve show in IB Economics? The Lorenz curve plots the cumulative share of national income earned by each quintile of the population. The 45-degree line represents perfect equality. The further the Lorenz curve bows below this line, the greater the income inequality. The Gini coefficient is derived from the area between the curve and the line.
Q: Why does income inequality matter economically, not just morally? Excessive inequality reduces consumer spending (lowering aggregate demand), slows GDP growth, increases household debt, raises poverty rates, and generates political instability. Beyond a certain point, inequality actively undermines the economic growth it's often used to justify.
Stay well
Explore Topics:
IB Economics your IB Economics daily guide
IB Economics Macroeconomics equitable distribution of income is one of the main macro objectives together with, low inflation, sustainable economic growth, and low unemployment
IB Economics Diagrams Check Unit 21 for the Lorenz Curve and Gini Coefficient diagrams with explanations
IB Economics Activity book Module 3 Macroeconomics Unit 3.13 for the economics of inequality exam practice, activities, model answers and IB Economics Marking schemes
IB Economics Macroeconomics trade-offs for exploring in depth the relationship between economic growth and equity trade-off
IB economics Calculations Book make sure you check unit 20 for Inequality and Poverty calculations exercises, IB model answers, and IB marking schemes
IB Economics Fighting Inequality Transfer Payments & Taxes: Direct financial support (e.g., welfare payments) or public goods (e.g., healthcare, education) aimed at redistributing income and boosting opportunities for lower-income groups. Study this content.
IB Economics Subsidies - serve also to correct inequities, cover this unit
Read Next: IB Economics Measuring Economic Activity GDP, GNI & The Circular Flow
© Theibtrainer.com 2012-2026. All rights reserved.
Legal
Have a Tip? Send us a tip using our anonymous form