
IB Econ Inequality
Target Question:
What causes inequality in IB Economics and how can governments reduce it?
Everything you need to understand, measure, and evaluate economic inequality for your IB Economics course - causes, measurement tools, consequences, and government policy responses.
Full activity practice breakdown, exam practice, model answers and evaluation tools are available exclusively in the IB Economics Activity Book.


What Is Economic Inequality?
Economic inequality refers to the unequal distribution of income and wealth among individuals or groups within a society. It is distinct from - though related to - poverty: a country can have low absolute poverty but high inequality (most people are above subsistence level but the gap between richest and poorest is large), or relatively low inequality with pockets of severe poverty.
IB Economics distinguishes between two different approaches to inequality:
Income inequality - differences in earnings, wages, salaries, and transfer payments received by individuals over a period of time. It is the most commonly measured and most directly affected by government policy.
Wealth inequality - differences in the stock of assets owned: property, financial assets, business ownership. Wealth inequality is consistently higher than income inequality in every country, because wealth accumulates over time and is transmitted across generations through inheritance.
IB Economics definition:
Economic inequality refers to the unequal distribution of income and wealth across a population. It is measured using tools such as the Lorenz curve and Gini coefficient, and arises from differences in factor endowments, human capital, market power, and structural factors including discrimination and inheritance.
Measuring Inequality: The Lorenz Curve and Gini Coefficient
The Lorenz Curve
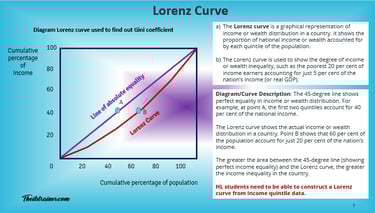
The Lorenz curve plots the cumulative share of total income received against the cumulative share of the population, ranked from poorest to richest. The line of perfect equality is a 45-degree diagonal - representing a hypothetical distribution where every person receives an identical income share. The further the Lorenz curve bows below this line, the greater the inequality.
Reading the Lorenz curve: if the bottom 40% of the population receives 15% of total income, that point is plotted at (40, 15). The gap between this point and the 45-degree line represents the degree of inequality at that percentile.
The Gini Coefficient
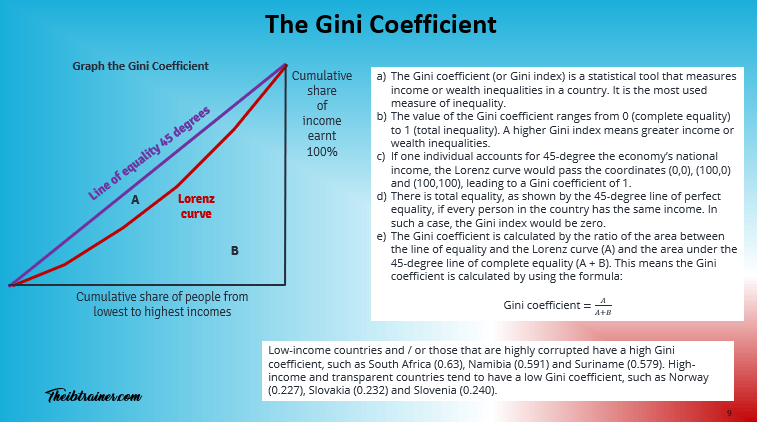
The Gini coefficient is a single numerical summary of inequality derived from the Lorenz curve. It is calculated as:
Gini = Area between the line of equality and the Lorenz curve ÷ Total area below the line of equality
A Gini of 0 represents perfect equality; a Gini of 1 represents perfect inequality (one person receives all income). In practice, Gini coefficients range from around 0.24 (highly equal societies such as Slovakia and the Nordic countries) to above 0.60 (highly unequal societies such as South Africa).
Limitations of the Gini coefficient: it summarises the entire distribution in a single number, losing information about where in the distribution inequality is concentrated. Two countries can have identical Gini coefficients but very different distributions - one with a large middle class and two extreme tails, another with a more even but generally low distribution. The Palma ratio (income share of top 10% divided by income share of bottom 40%) is an alternative that focuses on the extremes.
Absolute and Relative Poverty
Absolute poverty is defined by a fixed threshold - typically the World Bank's international poverty line of $2.15 per day (2022 PPP) - below which individuals cannot meet basic needs. It is primarily relevant in the context of development economics.
Relative poverty is defined relative to the median income of a society - commonly set at 60% of median household income. It measures social exclusion and the inability to participate in the living standards of the broader community, rather than simple survival. It is the more relevant measure in high-income countries.
The difference between both terms is very relevant to economic policy: absolute poverty can be theoretically eliminated through economic growth alone; relative poverty can persist or worsen even as average incomes rise if growth is concentrated at the top.
Causes of Inequality
Market Forces
Factor endowments - individuals differ in the quantity and quality of productive factors they own. Those with more human capital (education, skills, experience) command higher wages; those with financial or physical capital earn returns on assets. These differences compound over time.
Education and human capital - access to quality education is a primary driver of wage inequality. The skills premium - the wage gap between high-skilled and low-skilled workers - has widened in most advanced economies as technology increases demand for cognitive skills relative to routine labour.
Technological change - technology tends to be skill-biased: it complements high-skilled workers (raising their productivity and wages) while substituting for routine tasks performed by middle-skill workers. This creates job polarisation - growth at the top and bottom of the wage distribution, hollowing out the middle.
Globalisation - trade and investment flows affect wage distribution. The Stolper-Samuelson theorem predicts that in labour-abundant developing countries, trade raises wages of low-skilled workers (their abundant factor); in capital-abundant developed countries, it may reduce them - contributing to inequality in richer nations while reducing it globally.
Structural Factors
Market power and rent-seeking - firms with monopoly power can extract economic rents, concentrating income among owners and shareholders. Rent-seeking behaviour (using political influence to secure favourable regulation) similarly transfers income without creating value.
Discrimination - gender, racial, and other forms of discrimination reduce wages and restrict access to opportunities for affected groups, independently of human capital differences. The global gender pay gap remains approximately 16%, only partly explained by differences in hours, occupation, or experience.
Inheritance and intergenerational wealth - wealth transfers across generations are a powerful driver of wealth inequality. Children born to wealthy families have access to better education, social networks, and start-up capital. Intergenerational mobility - the degree to which individuals can move up or down the income distribution relative to their parents - is lower in highly unequal societies.
Consequences of Inequality
Economic growth - the relationship between inequality and growth is contested. Moderate inequality may encourage effort and risk-taking; extreme inequality can reduce growth by limiting human capital accumulation among the poor, suppressing consumption (lower-income households have higher marginal propensity to consume), and creating political instability. The IMF and OECD have both published research suggesting high inequality reduces growth sustainability.
Social cohesion and health - Wilkinson and Pickett's research (The Spirit Level) argues that more unequal societies show worse outcomes across a wide range of measures: health, trust, crime, education, and social mobility - independent of average income levels.
Political inequality - high economic inequality tends to translate into political inequality, as wealthy individuals and corporations gain disproportionate influence over policy through lobbying and campaign finance. This can create self-reinforcing cycles where inequality shapes the policies designed to address it.
Climate inequality - a striking dimension of contemporary inequality: the poorest 50% of the global population is responsible for approximately 12% of global carbon emissions but faces an estimated 75% of the income losses from climate change. This creates a major distributional challenge for climate policy.
IB Economics - Syllabus and Programme Full Guide →
Government Intervention: Reducing Inequality
Progressive Taxation
A progressive tax takes a higher percentage of income from higher earners, compressing the post-tax income distribution. Income tax, capital gains tax, and inheritance tax are the primary tools.
Evaluation: progressive taxation reduces disposable income inequality but may affect incentives to work, save, and invest if marginal rates are very high - the Laffer curve argument. Tax avoidance and evasion by high-income individuals can significantly reduce the redistribution achieved in practice.
Transfer Payments
Cash transfers - unemployment benefits, housing support, child tax credits, and pensions - directly supplement the incomes of lower-income households. Together with progressive taxation, they represent the core of the welfare state.
Evaluation: transfer payments can reduce relative poverty significantly, but means-tested programmes carry the risk of poverty traps - where benefits withdrawn as income rises create high effective marginal tax rates for low earners, reducing work incentives. Universal benefits avoid this but are less targeted and more costly.
Labour Market Policies
Minimum wages set a floor under earnings, directly raising incomes at the bottom of the distribution. Evidence on employment effects is mixed - monopsony theory suggests minimum wages may have little effect on employment where employers have wage-setting power over workers.
Collective bargaining and trade unions historically determined wage distributions by giving workers increasing power against employers. Union density has declined significantly in most advanced economies since the 1980s, which some economists associate with rising inequality.
Education and training investment addresses inequality at source - building human capital among disadvantaged groups improves long-run earning potential more sustainably than cash transfers alone.
The Kuznets Curve Hypothesis
The Kuznets curve predicts that inequality first rises then falls as countries develop economically - an inverted U-shape. In early industrialisation, inequality rises as workers shift from low-productivity agriculture to higher-productivity industry. As development matures and the structural transformation completes, inequality falls.
Evaluation: the Kuznets hypothesis has weak empirical support in the contemporary period - many developing countries have experienced rising inequality alongside growth, while some have achieved growth with relative equality (South Korea, Taiwan) through targeted redistribution and land reform. It should be treated as a hypothesis to evaluate rather than a reliable prediction.
Inequality in the IB Economics Exam
Inequality appears across IB Economics primarily in the macroeconomics and The Global Economy modules:
IB Economics Paper 1 - essay questions ask students to explain causes of inequality using the Lorenz curve, evaluate government policies to reduce inequality, or discuss the relationship between inequality and economic development. The 15-mark question requires genuine evaluation: the equity-efficiency trade-off, limitations of each policy tool, and a supported judgement.
IB Economics Paper 2 - data response questions present inequality data (Gini coefficients, income share statistics) and ask students to interpret trends, identify causes, or assess policy effectiveness.
IB Economics Paper 3 HL - extended questions may integrate inequality with development economics, trade theory, or macroeconomic policy.
Most common exam mistakes: drawing the Lorenz curve incorrectly (the curve must lie below and to the right of the 45-degree line, touching it only at the endpoints); confusing income and wealth inequality; evaluating progressive taxation without acknowledging incentive effects; discussing inequality only in terms of income rather than wealth.
IB Economics Poverty & Development - Full Guide →
IB Economics Government Intervention - Full Guide →
IB Economics Lorenz Curve and Gini Diagrams - Full Visual Guide → bottom of this page
IB Economics Diagrams Course
Every inequality diagram you need - Lorenz curve construction, Gini coefficient illustration, and pre vs post-tax distribution comparisons - fully labelled with video support.
✔ Lorenz curve with line of perfect equality
✔ Pre-tax vs post-tax Lorenz curve comparison
✔ 200+ diagrams covering the full syllabus - Both IB Economics SL and IB Economics HL labelled
Frequently Asked Questions: Inequality in IB Economics
What is the difference between income and wealth inequality? Income inequality refers to differences in the flow of earnings - wages, salaries, and transfer payments - over a period of time. Wealth inequality refers to differences in the stock of assets owned - property, financial investments, business ownership. Wealth inequality is consistently higher than income inequality in every country because wealth accumulates over time and is transferred across generations through inheritance.
What does the Gini coefficient measure in IB Economics? The Gini coefficient measures overall income inequality on a scale from 0 (perfect equality) to 1 (perfect inequality). It is derived from the Lorenz curve - calculated as the area between the line of perfect equality and the Lorenz curve divided by the total area below the line of equality. A higher Gini indicates greater inequality. South Africa has one of the world's highest at approximately 0.63; Nordic countries are among the lowest at around 0.25-0.28.
What are the main causes of inequality in IB Economics? The main causes are differences in human capital (education and skills), factor endowments (ownership of land and capital), technological change (which favours high-skilled workers), globalisation (which affects relative factor prices), market power and rent-seeking, discrimination, and intergenerational wealth transfer through inheritance. Structural factors - particularly access to education and the financial system - play a major role in perpetuating inequality across generations.
How can governments reduce inequality in IB Economics? The main tools are progressive taxation (higher rates on higher incomes), transfer payments (benefits and social insurance), public provision of education and healthcare, minimum wages, and anti-discrimination legislation. Evaluation must acknowledge trade-offs: progressive taxes may affect work incentives; means-tested benefits can create poverty traps; minimum wages may reduce employment in competitive labour markets. Education investment is generally considered the most sustainable long-run approach.
What is the Kuznets curve and is it relevant today? The Kuznets curve predicts an inverted-U relationship between inequality and development: inequality rises in early industrialisation then falls as development matures. Its empirical support is weak in the contemporary period - many countries have experienced rising inequality alongside sustained growth, while others achieved growth with equality through deliberate redistribution policy. Students should treat it as a hypothesis to evaluate rather than a reliable prediction.
This hub is updated regularly to reflect current IB Economics syllabus requirements and global inequality data.
IB Economics Key Inequality Graphs
Complete IB Economics Activity Book:
52 Complete Units including Inequality
Every unit from all four modules: Every topic. Every concept. Every theory. Nothing left out.
900+ Practice Activities
Complete IB Standard Model Answers
IB Standard Marking Schemes
Exam Practice Questions
Always Updated The Living Resource Advantage
Read More About:
IB Economics your IB Economics daily guide
IB Economics The Global Economy access Inequality, measuring economic development, Barriers to economic development and strategies for economic development here as well as the rest of the module 4
IB Economics Activity book Unit 3.13 for economics of inequality and Units 4.9 to 4.13 for Inequality, measuring economic development, Barriers to economic development and strategies for economic development exam practice, activities, model answers and IB Economics Marking schemes
IB Economics Diagrams Check Unit 21 for economics of inequality and units 29 for Measuring Economic development and 30 for Barriers to growth and / or Economic Development diagrams with explanations
IB economics Calculations Book make sure you check unit 20 for Economics of Inequality and Poverty calculations exercises, IB model answers, and IB marking schemes
Read Next: IB Economics Unemployment


© Theibtrainer.com 2012-2026. All rights reserved.
Legal
Have a Tip? Send us a tip using our anonymous form