
IB Economics Tariffs & Trade Protection
Discover how tariffs actually work, who wins, who loses, and how to calculate their effects. Essential knowledge for IB Economics students!
IB ECONOMICS HLIB ECONOMICSIB ECONOMICS SLIB ECONOMICS THE GLOBAL ECONOMY / INTERNATIONAL TRADE
Lawrence Robert
4/30/202512 min read
Trump Just Taught the World an Economics Lesson. Let's Go Through It.
Target Question:
What are the types of trade protection in IB Economics and how do tariffs affect different stakeholders?
In April 2025, the US President imposed sweeping tariffs on almost every country on earth. The global economy looked in disbelief. Markets crashed. Countries retaliated. And of course every IB Economics teacher updated (or should have updated) their trade protection lesson plans.
Since January 2025, the US imposed sweeping reciprocal tariffs of 10–50% on imports from most trading partners, plus 25% tariffs on global steel and aluminium, triggering retaliatory measures from the EU, Canada, and China and raising concerns about the future of the rules-based multilateral trading system
The Day the Trade War Arrived
Let's go back a few months. It's 2 April 2025. Donald Trump - back in the White House for his second term - stands in the Rose Garden and announces what he calls "Liberation Day." The US will impose reciprocal tariffs on virtually every country it trades with. Tariffs ranging from 10% to over 50%. China has been hit hard. But so have the EU, Japan, South Korea, and yes - the UK too.
Within hours, global stock markets are basically going down. Companies are scrambling to reroute supply chains. Foreign governments are all meeting in emergency cabinet sessions. The EU is the first to react and threatens €90 billion in retaliatory tariffs. Canada hits back. China hits back harder.
And here you are, studying IB Economics, watching the exact topic you're revising happening in real time on the world stage. Trade protection is possibly the most currently relevant chapter in your entire IB Economics course.
IB Economics definition - Trade protection:
The deliberate attempt by a government to protect domestic producers from foreign competition through trade barriers - obstacles that reduce the price competitiveness of foreign firms in the domestic market.
Internal Assessment (IA) Guide – Free Download
Step-by-step support on topic selection, structure, evaluation, and most common IB Economics IA mistakes.
Understanding key IB Economics Internal Assessment concepts
Applying and explaining them in real-world IB Economics contexts
Building IB Economics IA confidence without drowning in dry theory and explanations.
Download the IA guide now for free and boost your IB Economics grades and confidence
Why Would Any Government Do This?
Before covering the types of protection, we need to understand the motivation. Because - and this is important for your essays - trade protection isn't something irrational. Governments have real reasons to shield domestic industries from foreign competition, even if economists generally argue the long-run costs outweigh the benefits.
The logic: many countries have comparative advantages in certain goods. In the short run, this means foreign firms can undercut domestic producers on price. An Indonesian rice farmer simply cannot compete with a Thai or Vietnamese exporter on cost. A US steelmaker struggles against Chinese steel, a sector heavily supported by state subsidies. In the short run, domestic firms lose revenue. In the long run, they might close down entirely - meaning job losses, ghost towns, political agitation and social unrest.
Trade barriers are obstacles governments use to reduce the competitiveness of foreign firms and protect national interests. The question is always: at what cost?
IB Economics Definition - Trade Protection:
The deliberate attempt by a government to protect domestic producers from foreign competition by implementing trade barriers - obstacles that reduce the price competitiveness of foreign firms in the domestic market.
The Four Types of Trade Protection
There are four main instruments available to governments when they want to reduce foreign competition. Think of them as four different ways to make it harder for foreign goods to compete in your market.
1- Tariffs
Specific indirect taxes imposed on imported goods and services. They raise the price of foreign goods, making domestic products more competitive by comparison.
IB Economics definition - Tariff:
So, a tariff is a specific indirect tax imposed on imported goods or services. It raises the price of foreign goods, reducing their competitiveness and protecting domestic producers from foreign competition
IB Economics Real-life Example:
The US imposed 25% tariffs on steel and aluminium imports in 2025 under Section 232, applying them even to close allies like Canada and the UK.
2- Quotas
Quantitative limits on the amount of a specific good that can be imported in a given period. Unlike tariffs, they directly limit the volume of imports rather than their price.
IB Economics definition - Quota:
A quota is a quantitative limit on the volume of a specific good that may be imported during a given period. Unlike tariffs, quotas restrict the volume of trade rather than its price.
IB Economics Real-life Example:
Under the UK-US 2025 deal, the UK can export up to 100,000 passenger vehicles to the US annually at a 10% tariff - a quota-style cap on preferential access.
3- Export Subsidies
These are government payments to domestic firms to reduce their costs of production, enabling them to sell exports at artificially lower prices on world markets - undercutting foreign competitors.
IB Economics definition - Export Subsidy:
Is a government payment to domestic firms that reduces their costs of production, enabling them to sell exports at artificially lower prices in global markets and undercut foreign competitors.
IB Economics Real-life Example:
China's state subsidies to its electric vehicle manufacturers allowed Chinese EVs to be sold in Europe at prices European producers couldn't match, triggering EU tariffs of up to 35.3% on Chinese EVs in late 2024.
4- Administrative Barriers
Non-tariff barriers - complex regulations, safety standards, labelling requirements, or lengthy customs procedures - that make it difficult or expensive for foreign firms to access a market.
IB Economics Real-life Example:
Post-Brexit UK food exports to the EU face extensive veterinary checks and paperwork that didn't exist pre-2021 - a form of administrative barrier that has increased costs and reduced UK food export volumes.
Tariffs - The Most Important Tool
Of the four instruments, tariffs are the one IB Economics goes in depth - both for analysis and for calculation at IB Economics HL level. Let's walk through how they work, using Indonesian rice market as our example.
How Tariffs Work: Step by Step
Indonesia is one of the world's largest rice-consuming nations. Its domestic rice farmers - around 26 million smallholder households - grow rice across Java, Sumatra, and Bali. Thailand and Vietnam can produce rice far more efficiently and export at a world price well below the minimum price Indonesian farmers need to stay profitable. Without government intervention, cheap imported rice floods the market and Indonesian farmers go bankrupt.
The Indonesian government regularly imposes import tariffs on rice - sometimes alongside import quotas managed by the state logistics agency BULOG - basically to protect its farming communities. The political pressure to do so is huge: Indonesian rice farmers represent a significant voting bloc and rice is a staple food with deep cultural significance. This is basic trade protection theory and survival in a country that has a population of 287 million people.
IB Economics - Syllabus and Programme Full Guide →
Tariff Diagram - The Indonesian Rice Market
At world price PW, domestic demand is at Q4 but Indonesian farmers only supply Q1
The gap (Q4 − Q1) is filled by cheaper Thai and Vietnamese imports
The Indonesian government imposes a tariff → SWORLD shifts upward → price rises from PW to PWT
Higher price → domestic supply expands from Q1 to Q2 (Indonesian farmers produce more)
Higher price → domestic demand contracts from Q4 to Q3 (consumers buy less rice)
Imports fall from (Q4 − Q1) to the smaller gap (Q3 − Q2)
Government earns tariff revenue = area e = the tariff amount × remaining import volume
Areas d + f = deadweight welfare loss - the net social cost of the tariff
The tariff raises the domestic price of rice above the world price, protecting Indonesian farmers but making rice more expensive for 287 million Indonesian consumers - many of them on low incomes for whom rice is a dietary staple. The tension between protecting farmers and keeping food affordable for the urban poor, is one of the most defining political challenges Indonesian economic policy faces. Let's look at who wins and who loses more precisely - because this is where you will need to excel at in the exam.
Who Wins and Who Loses from a Tariff?
Consumers - Clear Losers
Pay a higher price (PWT > PW) for rice
Demand falls from Q4 to Q3 - less rice consumed overall
Consumer surplus falls from area a+b+c+d+e+f to area a+b
Particularly damaging for low-income urban households for whom rice is a dietary staple
Domestic Producers - Clear Winners
Receive a higher price for their rice
Domestic output expands from Q1 to Q2
Producer surplus rises from area g to area c+g
Increased sales revenue supports employment across millions of smallholder farming households
Foreign Producers - Clear Losers
Export volume to Indonesia falls as their goods become less price-competitive
Revenue from the Indonesian market declines significantly
The comparative advantage Thai and Vietnamese exporters held may be limited or completely abolished by the tariff
Must compete on quality rather than price - or redirect exports to other markets
Government - A Mixed Outcome
Earns tariff revenue = area e - a direct fiscal gain
Protects rural livelihoods and maintains political support from farming communities
Risks retaliation from Thailand and Vietnam, and potential WTO complaints
Faces domestic criticism for raising food prices for the urban poor
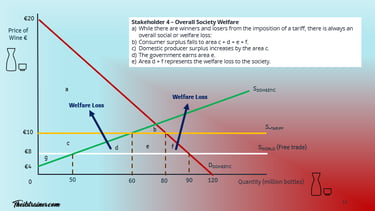
Society Overall - Net Welfare Loss
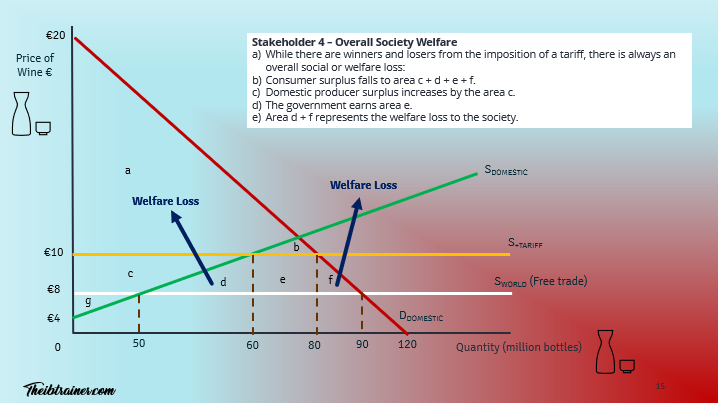
Social surplus before tariff = area a+b+c+d+e+f+g
Social surplus after tariff = area a+b+c+g (consumer surplus) +e (government revenue)
Areas d+f represent deadweight welfare loss - pure inefficiency with no offsetting gain
Area d = cost of inefficient domestic production being protected by the tariff
Area f = loss to consumers from reduced consumption at higher prices
IB Economics Exam Tip - Social Welfare Loss Is Always Net Negative Even though some stakeholders gain (domestic producers, government), there is always an overall net welfare loss from a tariff. The gain to producers (area c) and the government revenue (area e) are merely transfers - they come directly out of consumer surplus. But areas d and f represent a genuine loss with no offsetting gain anywhere. This is the core efficiency argument against trade protection - always worth a paragraph in your IB Economics essays.
A tariff always produces a net social welfare loss. While consumer surplus falls, the gains to domestic producers (area c) and government revenue (area e) are merely redistributive transfers. Areas d and f represent genuine deadweight losses - inefficiencies with no offsetting economic gain.
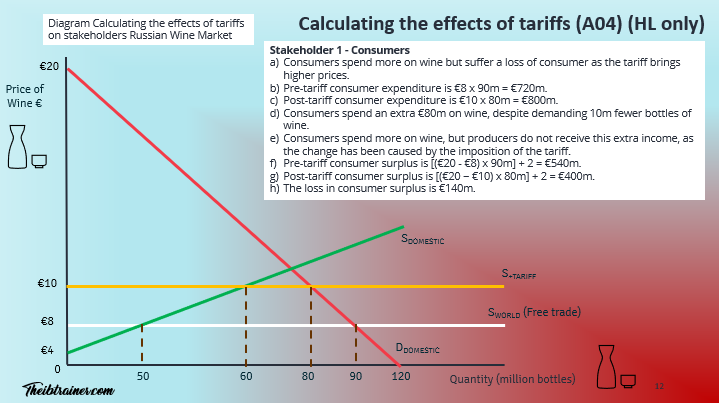
HL Only: Calculating the Effects of Tariffs
When the IB Economics board decides to test tariffs at HL it will usually give you a diagram with specific numbers and ask you to calculate exactly how much consumers lose, how much producers gain, and how much revenue the government earns. Here's the full worked calculation continuing with our Indonesian rice market.
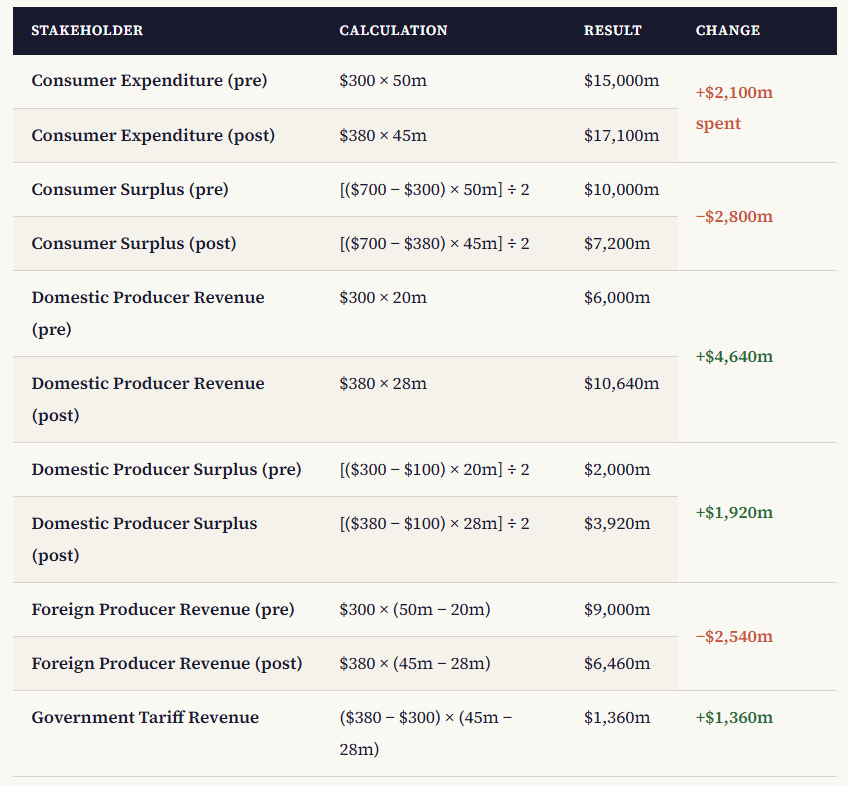
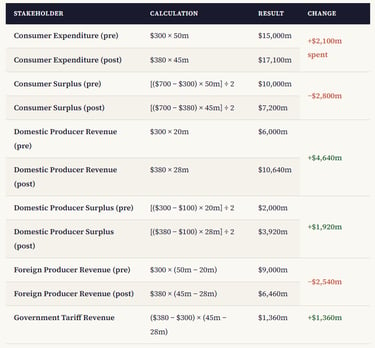
Assume: World price PW = $300/tonne, tariff price PWT = $380/tonne, maximum price on demand curve = $700/tonne, minimum supply price = $100/tonne. Pre-tariff: demand = 50m tonnes, domestic supply = 20m tonnes. Post-tariff: demand = 45m tonnes, domestic supply = 28m tonnes.
Full Stakeholder Calculation - Indonesian Rice Market
Remember:
consumer surplus = (max price − market price) × quantity ÷ 2.
Producer surplus = (market price − min supply price) × quantity ÷ 2.
Government tariff revenue = tariff per unit × volume of remaining imports.
For access to all IB Economics exam practice questions, model answers, IB Economics complete diagrams together with full explanations, and detailed assessment criteria, explore the Complete IB Economics Course
IB Economics HL Exam Tip - The Consumer Expenditure Trap Notice that after the tariff, Indonesian consumers spend more ($17,100m vs $15,000m) even though they buy fewer tonnes of rice. Some of my students have issues with this concept. They're paying more per tonne and their consumer surplus still falls dramatically. The producers and government don't receive the full extra expenditure - it's redistributed from consumers, not created from nothing. Don't confuse higher expenditure with higher welfare.
Back to 2025: The World's Biggest Live Trade Protection Case Study
Let's apply the theory.
Trump's Tariffs (2025) - A Tariff Case Study Taking Place Right Now
Since January 2025, President Trump has imposed new tariffs across virtually all US trading partners, using emergency economic powers to justify them on national security grounds. The US imposed 25% tariffs on steel and aluminium globally. Reciprocal tariffs of 10–50% on country-specific imports. China has faced cumulative tariffs exceeding 100% on some goods at various points in 2025.
What you learnt in class from your teacher's explanations has progressed exactly as predicted:
US consumers face higher prices on imported goods - from electronics and cars to steel-based products
US domestic producers in protected industries gain revenue and market share
Foreign exporters - EU manufacturers, UK car producers, Chinese tech firms - face reduced competitiveness in the US market
The US government earns tariff revenue - but multiple federal courts have questioned the legal basis of some actions
Global welfare is reduced: the EU prepared €90 billion in retaliatory tariffs (suspended after a deal in August 2025), and the WTO system faces the most serious challenge in decades
EU Tariffs on Chinese Electric Vehicles - An Export Subsidy Response
In late 2024, the EU imposed additional tariffs of up to 35.3% on Chinese electric vehicles, citing Chinese state subsidies that allowed Chinese producers to sell EVs at prices European manufacturers could not match - a direct application of the countervailing tariff mechanism.
Why was this? Because Chinese EV manufacturers - companies like BYD, SAIC, and Geely - were receiving massive Chinese state subsidies that allowed them to sell cars in Europe at prices European manufacturers couldn't match.
This is the export subsidy → retaliatory tariff chain playing out in practice. China subsidises its domestic producers → Chinese EVs flood European markets at artificially low prices → European firms lose market share → EU responds with countervailing tariffs → China protests to the WTO. Every single step of that is in your IB Economics syllabus.
UK Steel - The Administrative Barrier and Quota in One Paragraph
The UK-US Economic Prosperity Deal of May 2025 is a enticing case study in trade protection negotiation. The US had imposed 25% tariffs on UK steel and aluminium. Under the deal's terms, the UK could potentially have these removed - but only if it met US supply chain security requirements. And UK car exports to the US were limited at 100,000 vehicles annually at a 10% preferential tariff.
That cap on car exports is a quota with another name - a quantitative limit disguised in trade deal terminology. Your IB Economics examiner would recognise it immediately.
Every episode of Pint-Sized links back to what matters most for your IB Economics course:
Understanding key IB Economics concepts
Applying them in real-world IB Economics contexts
Building IB Economics course confidence without drowning in dry theory.
Subscribe for free to exclusive episodes designed to boost your IB Economics grades and confidence
IB Economics Summary
Tariffs are rising globally. Countries are subsidising strategic industries to overperform competitors. Administrative barriers are multiplying. The WTO's authority is being challenged. Retaliation tariffs have become the norm.
For your IB Economics exams, the key is to always present both sides. Governments have legitimate reasons to protect domestic industries - jobs, national security, infant industries, food security. But the economic cost is evident: higher prices for consumers, welfare losses, retaliatory tariffs, reduced global efficiency. The best essays acknowledge both, evaluate the impact of each, and reach a justified conclusion.
IB Economics Diagrams Programme, What's included:
200+ exam-ready diagrams covering the entire IB Economics syllabus
Video for every diagram showing you exactly how each model looks
Image version perfect for modelling diagrams in you essays, presentations, and your IA
Detailed written explanations of the IB Economics theory behind each diagram
Both SL and HL IB Economics diagrams clearly labelled and organised by topic
Real IB Economics exam application showing how to use diagrams effectively in Paper 1 and Paper 2
Frequently Asked Questions: Tariffs and Trade Protection (IB Economics)
Q1: What are the four types of trade protection in IB Economics?
The four types are: (1) tariffs - indirect taxes on imported goods; (2) quotas - quantitative limits on import volumes; (3) export subsidies - government payments to domestic firms to reduce export costs; and (4) administrative barriers - regulations, safety standards, or customs procedures that make importing more difficult and expensive.
Q2: How does a tariff affect consumers, producers, and the government?
Consumers lose - they pay higher prices and consumer surplus falls. Domestic producers gain - they receive higher prices, expand output, and earn greater producer surplus. Foreign producers lose - their goods become less competitive and their revenue falls. The government gains tariff revenue. Overall, society suffers a net welfare loss from areas d and f on the tariff diagram - deadweight losses with no compensating economic gain.
Q3: What is deadweight welfare loss in a tariff diagram?
Deadweight welfare loss from a tariff is represented by areas d and f on the standard diagram. Area d is the cost of inefficient domestic production being kept alive by the tariff - resources used to produce output that could be imported more cheaply. Area f is the loss to consumers from reduced consumption at higher prices. Together they represent the net economic cost of the tariff - a genuine loss to society with no corresponding gain.
Q4 (HL): How do you calculate government tariff revenue?
Government tariff revenue = tariff amount per unit × volume of imports after the tariff is imposed. The tariff amount = PWT − PW. The volume of remaining imports = Q3 − Q2 (post-tariff demand minus post-tariff domestic supply). On the diagram, this is represented by area e.
Q5: What is the difference between a tariff and a quota?
A tariff is a tax that raises the price of imports - it lets any quantity be imported as long as the tariff is paid. A quota is a quantitative limit - it caps the volume of imports regardless of price. A key difference: a tariff generates government revenue; a quota does not (the benefit instead goes to whoever holds the import licence). Both protect domestic producers, but through different mechanisms.
Stay well,
Read More About:
IB Economics your IB Economics daily guide
IB Economics The Global Economy access Trade protection, tariffs, quotas, subsidies and administrative barriers here as well as the rest of the module 4
IB Economics Activity book Module 4 The Global Economy Unit 4.3 for Types of Trade Protection exam practice, activities, model answers and IB Economics Marking schemes
IB Economics Benefits of International Trade - Explore this topic - why we value free trade before understanding why governments restrict it
IB Economics Diagrams Check Unit 26 for All Types of Trade Protection diagrams with explanations
IB Economics Comparative Advantage - Trade protection directly undermines comparative advantage
IB Economics Market Failure - Tariff deadweight welfare loss parallels the welfare loss triangles in market failure diagrams
IB Economics Fiscal Policy - Government tariff revenue is a form of indirect tax revenue - explore this relationship
IB Economics Indirect Taxes and IB Economics Subsidies - Tariff diagrams are conceptually identical to indirect tax diagrams - this is a major revision point
IB economics Calculations Book make sure you check unit 23 for Benefits of International trade and types of trade protection HL calculations exercises, IB model answers, and IB marking schemes
Read Next: IB Economics Quotas Import Restrictions

© Theibtrainer.com 2012-2026. All rights reserved.
Legal
Have a Tip? Send us a tip using our anonymous form