
IB PPC
Target Question:
What is a Production Possibility Curve in IB Economics and what does it show?
Full activity practice breakdown, exam practice, model answers and evaluation tools are available exclusively in the IB Economics Activity Book.

IB Economics: Production Possibility Curve (PPC) - Complete Hub
Everything you need to understand, draw, and apply the Production Possibility Curve for your IB Economics course - theory, opportunity cost, shifts, and real-world trade-offs.
What Is a Production Possibility Curve?
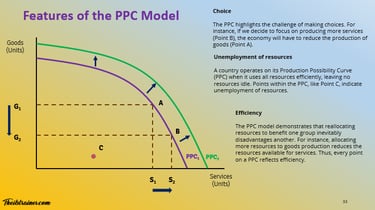
A Production Possibility Curve (PPC) - also called a Production Possibility Frontier (PPF) - is a diagram showing the maximum combinations of two goods or services an economy can produce when all resources are fully and efficiently employed.
It is one of the most fundamental models in IB Economics because it illustrates three core economic concepts simultaneously: scarcity (resources are limited), choice (producing more of one good requires producing less of another), and opportunity cost (the value of the next best alternative foregone).
IB Economics definition:
A Production Possibility Curve shows the maximum output combinations of two goods an economy can produce given its current resources and technology, assuming full and efficient resource use. Points on the curve represent productive efficiency; points inside represent inefficiency; points beyond the curve are currently unattainable.
The Shape of the PPC
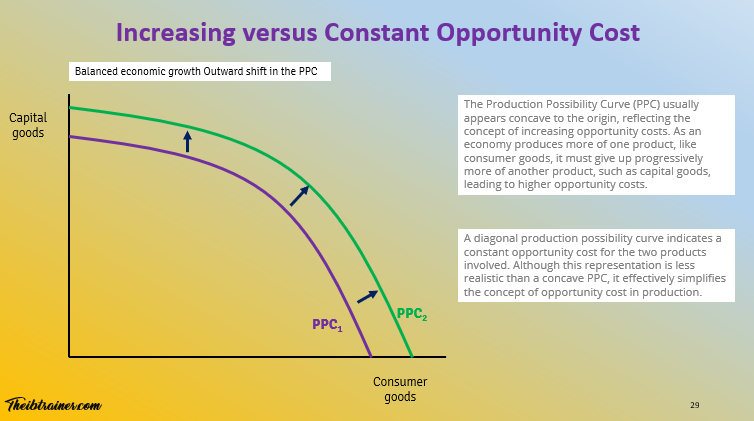
Concave PPC (bowed outward) - the standard shape in IB Economics. It reflects increasing opportunity cost: as production of one good increases, progressively more of the other good must be sacrificed. This occurs because resources are not perfectly adaptable between uses - as an economy shifts more resources toward producing good X, it draws in resources less and less suited to producing X, making each additional unit increasingly costly in terms of good Y forgone.
Linear PPC - a straight line reflects constant opportunity cost: equal amounts of one good must be sacrificed for each additional unit of the other. This occurs only when resources are perfectly substitutable between the two uses - a simplifying assumption used in some basic models.
The concave shape is the more realistic and more frequently examined version.
Points on the PPC
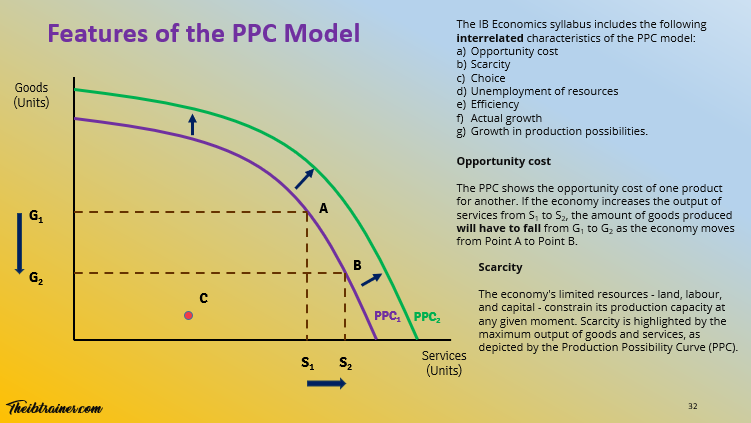
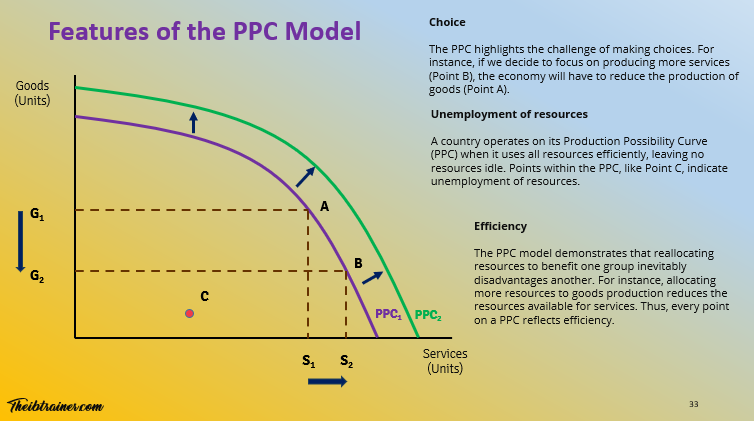
On the curve - any point on the PPC represents productive efficiency: all resources are fully employed and it is impossible to produce more of one good without producing less of the other.
Inside the curve - a point inside the PPC represents productive inefficiency: resources are unemployed or misallocated. The economy could produce more of one or both goods by moving to the curve. Recession, structural unemployment, or poor resource allocation can push an economy inside its PPC.
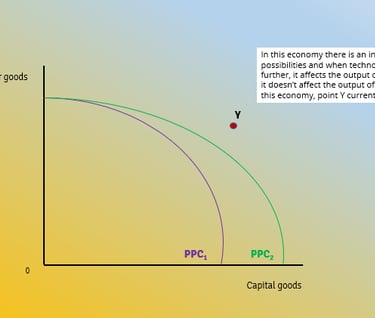
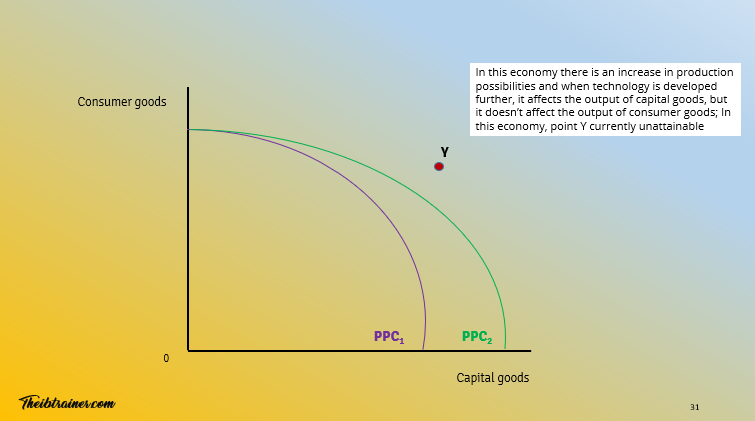
Outside the curve - currently unattainable with existing resources and technology. This is not impossible in the long run - it is what economic growth achieves.
Opportunity Cost and the PPC
The PPC makes opportunity cost visible. Moving along the curve from one point to another shows precisely how much of good Y must be sacrificed to produce additional units of good X. This is the opportunity cost of that production decision.
The slope of the PPC at any point measures the opportunity cost at that point. On a concave PPC, the slope becomes steeper as more of good X is produced - reflecting increasing opportunity cost.
Exam application: if a PPC question gives coordinates for two points on the curve, students may be asked to calculate the opportunity cost of moving between them. Divide the quantity of Y lost by the quantity of X gained.
Shifts of the PPC
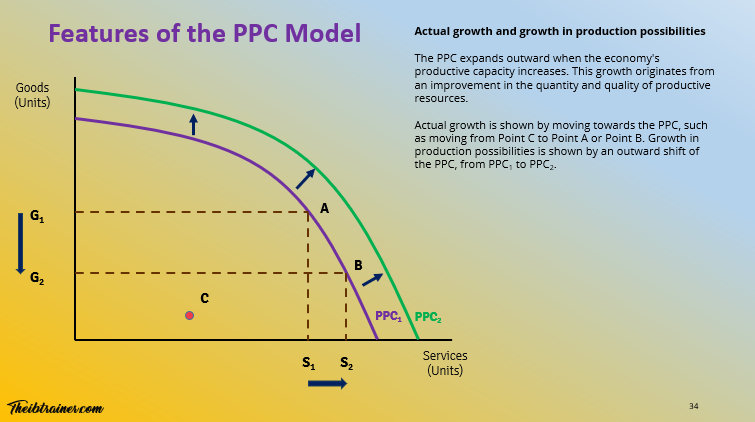
A shift outward (away from the origin) represents economic growth - the economy can now produce more of both goods. This occurs through:
Increase in quantity of resources - discovery of new raw materials, population growth, immigration increasing the labour force, capital accumulation
Improvement in quality of resources - better education and training (human capital), technological progress, improved management
Improved resource allocation - removing inefficiencies in how existing resources are deployed
A shift inward (toward the origin) represents a decrease in productive capacity - caused by natural disasters, war, emigration of skilled workers, or depletion of natural resources.
Movements along the PPC - these are not shifts. Moving along the existing curve simply reflects a reallocation of existing resources between the two goods, not a change in total productive capacity.
Key Trade-offs: PPC in Practice
The most commonly examined PPC application is the guns vs butter trade-off - the choice between defence spending (capital/security goods) and civilian consumption goods. NATO members committing to higher defence spending (the 2% and proposed 5% of GDP targets) face a genuine PPC trade-off: more resources allocated to defence means fewer resources available for healthcare, education, or infrastructure.
Capital goods vs consumer goods - this is perhaps the most important PPC application for long-run economic analysis. An economy that allocates more resources to capital goods (machinery, infrastructure, technology) moves to a point higher on the capital axis of its current PPC, but in doing so shifts its future PPC further outward. More capital today means greater productive capacity tomorrow. This directly illustrates the trade-off between present consumption and future economic growth - a key concept in development economics.
Environmental trade-offs - the PPC framework applies directly to sustainability debates. Producing more output today (extracting resources, generating emissions) can reduce future productive capacity - effectively shifting the future PPC inward. Sustainable development aims to maintain or expand productive capacity for future generations rather than exhausting it.
PPC and Development Economics
The PPC is particularly powerful for analysing economic development. Less developed economies often operate inside their PPC due to underemployment, poor infrastructure, and limited technology. The challenge is not just reaching the current curve - it is shifting the curve outward.
Outward PPC shifts in developing economies come from:
Foreign direct investment (FDI) - bringing capital and technology
Education and training - building human capital
Technology transfer - accessing more productive methods
Aid and debt relief - freeing fiscal resources for investment
Institutional improvements - reducing corruption and improving resource allocation
The constraint is that investing in growth (shifting the PPC outward) requires sacrificing current consumption - a particularly difficult trade-off for low-income populations. This is why external support for development investment is highly relevant: it relaxes the immediate trade-off.
PPC and Comparative Advantage
The PPC connects directly to international trade theory. If two countries have differently shaped PPCs - reflecting different opportunity costs of production - both can gain from specialising in the good they produce at lower opportunity cost and trading for the other. This is the basis of comparative advantage, and the PPC provides the visual explanation for understanding why specialisation and trade expand consumption possibilities beyond what any single country could achieve alone.
IB Economics Absolute and Comparative Advantage - Full Guide →
IB Economics Economic Growth - Full Guide →
PPC in the IB Economics Exam
The PPC appears primarily in the introduction to economics section and is examined across both SL and HL:
IB Economics Paper 1 - essay questions ask students to draw and interpret PPC diagrams, explain opportunity cost, distinguish shifts from movements, or apply PPC analysis to real-world trade-offs. Diagram accuracy is directly rewarded.
IB Economics Paper 2 - data response questions may present PPC scenarios with coordinates and ask students to calculate opportunity costs or interpret economic positions.
Most common exam mistakes: drawing a linear PPC when a concave shape is required; confusing a movement along the PPC with a shift; failing to label axes, points, and the curve itself; describing a point outside the PPC as inefficient rather than unattainable.
IB Economics PPC Explained - Full Diagram Visual Guide → also check bottom of this page
IB Economics Scarcity and Choice Full Guide →
IB Economics Diagrams Course
Every PPC diagram you need - concave vs linear, points analysis, outward and inward shifts, and capital vs consumer goods applications - fully labelled with video support.
✔ Standard concave PPC with full point analysis
✔ Outward and inward shift diagrams
✔ Capital vs consumer goods trade-off
✔ 200+ diagrams covering the full syllabus · Both SL and HL labelled
Frequently Asked Questions: Production Possibility Curve in IB Economics
What does a Production Possibility Curve show in IB Economics? A PPC shows the maximum combinations of two goods an economy can produce when all resources are fully and efficiently employed. It illustrates scarcity (the boundary of what is possible), choice (producing more of one good requires less of another), and opportunity cost (the value of what is sacrificed with each production decision).
Why is the PPC concave to the origin? The PPC is concave because of increasing opportunity cost. As an economy shifts more resources toward producing one good, it must use resources progressively less suited to that production - making each additional unit more costly in terms of the other good forgone. If all resources were equally adaptable to both uses, the PPC would be linear.
What is the difference between a movement along the PPC and a shift of the PPC? A movement along the PPC represents a reallocation of existing resources between two goods - productive capacity is unchanged. A shift of the PPC represents a change in productive capacity itself: an outward shift means the economy can produce more of both goods (economic growth); an inward shift means productive capacity has fallen.
What causes an outward shift of the PPC? An outward shift - economic growth - is caused by an increase in the quantity or quality of resources: discovery of natural resources, population growth, capital accumulation, technological progress, improved education, or better resource allocation. In development economics, FDI, technology transfer, and institutional improvements are key drivers.
How does the PPC relate to opportunity cost? The slope of the PPC at any point measures the opportunity cost of producing one more unit of the good on the horizontal axis - it shows how much of the good on the vertical axis must be sacrificed. On a concave PPC, this opportunity cost increases as production of the horizontal good rises, which is why the curve bows outward rather than forming a straight line.
This hub is updated regularly to reflect current IB Economics syllabus requirements and exam developments.
Key PPC/PPF Diagrams
Complete IB Economics Activity Book:
52 Complete Units including IB Economics PPC
Every unit from all four modules: Every topic. Every concept. Every theory. Nothing left out.
900+ Practice Activities
Complete IB Standard Model Answers
IB Standard Marking Schemes
Exam Practice Questions
Always Updated The Living Resource Advantage
Read More About:
IB Economics your IB Economics daily guide
IB Economics Introduction to Economics access PPC / PPF here as well as the rest of the module 1
IB Economics Activity book Module 1 Introduction to Economics Unit 1.3 for PPC / PPF exam practice, activities, model answers and IB Economics Marking schemes
IB Economics Diagrams Check Unit 1 for All PPC / PPF diagrams with explanations
IB Economics Absolute and Comparative Advantage: The PPC / PPF is directly related to comparative advantage
IB Economics Calculations Book make sure you check unit 1 for PPC / PPF calculations exercises, IB model answers, and IB marking schemes
Read Next: IB Economics Exchange Rate

© Theibtrainer.com 2012-2026. All rights reserved.
Legal
Have a Tip? Send us a tip using our anonymous form