
Oligopoly IB
Target Question:
What is oligopoly in IB Economics and how does game theory explain strategic behaviour?
Everything you need to understand, and evaluate oligopoly for your IB Economics course - strategic interdependence, diagrams, game theory, the kinked demand curve, collusion, non-price competition, and efficiency analysis.
Full breakdowns of diagrams and evaluation tools are available exclusively in the IB Economics course.


What Is Oligopoly?
An oligopoly is a market structure dominated by a small number of large firms, each with significant market power and each aware that its decisions directly affect - and are affected by - the decisions of rivals. This strategic interdependence is the defining characteristic of oligopoly: unlike in perfect competition (where no firm affects market price) or monopoly (where there are no rivals to consider), oligopolists must anticipate and respond to each other's behaviour.
Oligopoly is the most common market structure in the real economy. Airlines, banks, supermarkets, telecommunications, streaming services, and semiconductor manufacturing are all organised as oligopolies - making this one of the most practically relevant topics in IB Economics.
IB Economics definition:
An oligopoly is a market structure characterised by a small number of large firms, significant barriers to entry, and strategic interdependence - where each firm's decisions about price, output, advertising, and innovation depend on anticipated responses from rivals. The result is a spectrum of outcomes ranging from collusion (monopoly-like outcomes) to price wars (approaching competitive outcomes).
Measuring oligopoly: the concentration ratio measures the market share of the largest N firms. A four-firm concentration ratio above 60-70% is typically considered oligopolistic. The Herfindahl-Hirschman Index (HHI) - the sum of squared market shares of all firms - provides a more sensitive measure used by competition authorities in merger analysis.
Strategic Interdependence and Game Theory
The central analytical tool for oligopoly is game theory - the study of strategic decision-making where outcomes depend on the choices of multiple players.
The Prisoner's Dilemma
The prisoner's dilemma is the foundational game theory model in IB Economics. When applied to oligopoly pricing, it explains why firms competing on price often end up worse off than if they had cooperated - even though cooperation would benefit both.
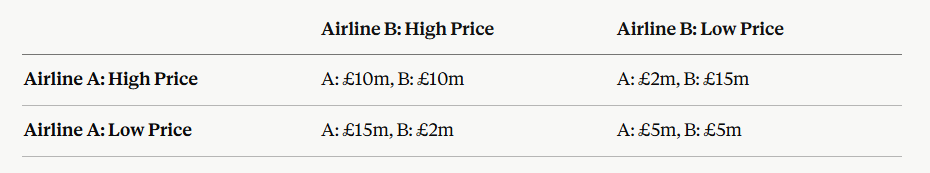
Example payoff matrix - two airlines choosing between high and low fares:
Analysis: regardless of what Airline B does, Airline A earns more by choosing low price (£15m > £10m if B is high; £5m > £2m if B is low). Low price is a dominant strategy for both firms. The Nash equilibrium - where neither firm wants to change given the other's choice - is (Low, Low), producing £5m each.
Yet if both had chosen high prices, each would earn £10m - a better outcome for both. The prisoner's dilemma shows why rational individual behaviour produces collectively suboptimal outcomes: each firm, acting in self-interest, destroys value for both.
This explains why oligopolies face persistent pressure toward price wars even when collusion would be more profitable - and why maintaining collusive agreements is inherently unstable.
Nash Equilibrium
A Nash equilibrium is a combination of strategies from which no player wishes to wander away from, given the strategies of others. It is the stable outcome of any strategic game. In the prisoner's dilemma above, (Low, Low) is the Nash equilibrium - neither firm profits from unilaterally switching to high price.
Not all Nash equilibria are efficient - the prisoner's dilemma demonstrates a Nash equilibrium that is worse for both players than the cooperative outcome. This represents the core argument in oligopoly analysis.
The Kinked Demand Curve
The kinked demand curve model (Sweezy, 1939) explains why prices in oligopoly tend to be sticky - remaining stable even when costs change.
The model's logic: each firm assumes that:
If it raises its price, rivals will not follow - so it loses customers to competitors (demand is elastic above the current price)
If it lowers its price, rivals will follow to protect their market share - so it gains few customers (demand is inelastic below the current price)
This creates a kink in the demand curve at the current price, with a steep section below and a flat section above. The corresponding marginal revenue curve has a vertical gap at the quantity where the kink occurs. As long as the marginal cost curve passes through this vertical gap, the profit-maximising output (MC = MR) remains unchanged - even when costs shift significantly. Prices remain stable. Source: IB Economics Diagrams
Limitations of the kinked demand curve model:
It explains why prices are stable but not how the current price was set in the first place
It assumes asymmetric reactions that do not always happen in real life
Empirical evidence for price rigidity in oligopoly is mixed
The model predicts stability but cannot explain how prices change when they do
Despite its limitations, the kinked demand curve remains directly examined in IB Economics - students must be able to draw it accurately and explain both its mechanism and its weaknesses.
Collusion: Formal and Tacit
If the prisoner's dilemma explains why collusion is attractive (both firms would be better off at high prices), why doesn't it always happen?
Formal Collusion - Cartels
A cartel is an explicit agreement between firms to fix prices, divide markets, or restrict output. By acting collectively as a monopolist, cartel members can maximise joint profits.
OPEC (Organisation of the Petroleum Exporting Countries) is the most examined cartel in IB Economics. Member countries agree on national production quotas to restrict global oil supply and maintain prices above the competitive level. OPEC's history illustrates both the potential gains from collusion and its inherent instability - members repeatedly exceed their quotas when prices are high, because each country individually gains from cheating while hoping others maintain restraint.
Why cartels are unstable: the prisoner's dilemma applies directly. Each cartel member has an incentive to cheat on the agreement (produce more, undercut the agreed price) while hoping others do not. The higher the agreed price, the greater the incentive to cheat. Cartels are also illegal in most economies - the legal risk adds to instability.
Tacit Collusion
Tacit collusion is coordination without explicit agreement - firms independently reach the same pricing outcome by reading each other's signals.
Price leadership is the most common form: one firm (typically the largest or most cost-efficient - the dominant firm) sets a price and others follow. No communication is required; each firm understands that matching the leader's price is mutually beneficial. UK supermarket pricing - where Tesco's promotions are rapidly matched by Sainsbury's and Asda - exhibits price leadership characteristics.
Tacit collusion is legal but can attract competition authority attention if the coordinated outcome appears suspiciously close to explicit collusion.
IB Economics - Syllabus and Programme Full Guide →
Non-Price Competition
A key feature of oligopoly is the tendency to compete on dimensions other than price. The prisoner's dilemma shows why price competition leads to mutually damaging outcomes - non-price competition avoids this trap.
Advertising and branding - heavy advertising expenditure builds brand loyalty, differentiates products, and creates barriers to entry. The classic example is the Coca-Cola/Pepsi duopoly: both products are chemically similar, yet billions are spent annually on advertising to maintain brand differentiation and consumer loyalty.
Product innovation and R&D - oligopolists invest heavily in new product development and technology to gain competitive advantage. The smartphone market (Apple, Samsung, Google) and pharmaceutical sector (where patent-protected drugs generate oligopolistic competition) are driven primarily by R&D competition.
Quality and customer service - competing on quality and service rather than price maintains revenue per customer without triggering price wars. Airlines' loyalty programmes, bank account features, and supermarket quality tiers all reflect non-price competition.
Evaluation: non-price competition benefits consumers through innovation and quality improvement (dynamic efficiency). However, advertising expenditure is a cost that raises prices and represents a welfare loss if it is purely persuasive rather than informative.
Contestable Markets
Contestable market theory (Baumol, 1982) challenges the assumption that few firms necessarily means high prices and welfare losses. A market is contestable if:
Entry and exit are free - no sunk costs
New entrants can access the same technology and costs as incumbents
Hit-and-run entry is possible - firms can enter, make profits, and exit before competitors retaliate
In a perfectly contestable market, the threat of entry disciplines competing firms to price at or near competitive levels - even if only one or two firms currently operate. The actual number of firms matters less than the potential for competition.
Real-life relevance: no market is perfectly contestable, but the theory explains why some oligopolies are more competitive than their concentration ratios suggest. Low-cost airline entry into routes previously dominated by full-service carriers forced pricing down substantially - the threat of entry, not just actual competition, drove the outcome.
Limitations: most real markets have significant sunk costs (brand investment, infrastructure, regulatory compliance) that make perfect contestability unrealistic. High sunk costs are themselves a barrier to entry that competing oligopolists can exploit.
Efficiency Evaluation
Allocative efficiency: oligopolists typically price above marginal cost - creating allocative inefficiency and a deadweight welfare loss. The magnitude depends on the degree of market power and whether competition is more collusive (monopoly-like outcome, large welfare loss) or competitive (approaching the efficient outcome).
Productive efficiency: oligopolists may or may not produce at minimum average cost. Competitive pressure - from rivals and potential entrants - provides some incentive for cost minimisation. Collusive oligopolies face weaker pressure and may be productively inefficient.
Dynamic efficiency: this is the most important argument for evaluation. Oligopolists generate supernormal profits that can fund R&D investment. The pharmaceutical, technology, and automotive sectors - all oligopolistic - drive most of the world's innovation. Schumpeter's creative destruction argument applies here directly: the prospect of supernormal profits incentivises the innovation that repeatedly disrupts existing oligopolies.
Key evaluation: static welfare analysis (deadweight loss from P > MC) makes oligopoly appear unambiguously harmful. Dynamic efficiency (innovation funded by profits) is the counter-argument. The balance depends on the industry: in stable commodity oligopolies, static inefficiency may dominate; in technology markets, dynamic efficiency gains likely outweigh static costs.
Oligopoly in the IB Economics Exam
Oligopoly is examined across all papers, primarily within the microeconomics module:
IB Economics Paper 1 - essay questions ask students to explain oligopoly characteristics, draw and analyse the kinked demand curve, evaluate collusion and its instability, or assess whether oligopoly is harmful. The 15-mark response must include genuine evaluation: the dynamic efficiency counter-argument, contestable market theory, and limitations of the kinked demand model.
IB Economics Paper 2 - data response questions present concentration ratios or market share data and ask students to identify oligopolistic structure, analyse pricing behaviour, or evaluate competition policy.
IB Economics Paper 3 HL - game theory (payoff matrices, Nash equilibrium, dominant strategies) is directly assessed. Students must construct and interpret payoff matrices and explain Nash equilibrium outcomes.
Most common exam mistakes: drawing the kinked demand curve without the vertical gap in the MR curve; confusing Nash equilibrium with Pareto efficiency; evaluating collusion without explaining the prisoner's dilemma logic; not addressing dynamic efficiency as a counter-argument to the welfare loss.
IB Economics Market Power - Full Guide →
IB Economics Monopoly - Theory and Diagrams →
IB Economics Monopoly Regulation and Competition Policy →
IB Economics Diagrams Course
Every oligopoly diagram - kinked demand curve with vertical MR gap, game theory payoff matrix, collusion output and price, and contestable market equilibrium - fully labelled with video support.
✔ Kinked demand curve with correct MR discontinuity
✔ Game theory payoff matrix construction and Nash equilibrium identification
✔ Collusion vs price war welfare comparison
✔ 200+ diagrams covering the full syllabus · Both SL and HL labelled
Frequently Asked Questions: Oligopoly in IB Economics
What is oligopoly in IB Economics? Oligopoly is a market structure dominated by a small number of large firms with significant barriers to entry. Its defining feature is strategic interdependence - each firm's decisions about price, output, and strategy depend on anticipated responses from rivals. This creates a variety of outcomes from collusion (jointly maximising profits like a monopolist) to price wars (approaching competitive outcomes), with the kinked demand curve model explaining why prices often remain stable in between.
What is the prisoner's dilemma and how does it apply to oligopoly? The prisoner's dilemma is a game theory model showing why rational individual decisions can produce collectively suboptimal outcomes. Applied to oligopoly: each firm has a dominant strategy to charge low prices (or cheat on a cartel agreement), even though both would be better off if they both charged high prices. The Nash equilibrium - low prices for both - is stable but worse for both firms than the cooperative outcome, explaining why price competition persists despite collusion being theoretically more profitable.
What is the kinked demand curve and what does it explain? The kinked demand curve model explains price stability in oligopoly. Each firm assumes rivals will not match a price rise (making demand elastic above the current price) but will match a price cut (making demand inelastic below it). This creates a kink in the demand curve and a vertical gap in the MR curve at the current price. As long as MC passes through this gap, profit-maximising output is unchanged even when costs shift - prices remain sticky. The model does not, however, explain how the current price was set initially.
Why are cartels inherently unstable? Cartels are unstable because of the prisoner's dilemma: each member has an incentive to cheat on the agreed price or quota while hoping others maintain restraint. Cheating produces higher profits for the cheater in the short run; if all members cheat simultaneously, the cartel collapses and all are worse off. The higher the agreed price, the greater the incentive to cheat. OPEC's history of members exceeding production quotas illustrates this instability directly.
Is oligopoly inefficient in IB Economics? Oligopoly is statically inefficient - prices exceed marginal cost, creating allocative inefficiency and deadweight loss. However, the dynamic efficiency counter-argument holds that oligopolistic supernormal profits fund R&D investment and innovation - the pharmaceutical and technology sectors demonstrate how oligopolistic competition drives significant technological progress. Whether static inefficiency or dynamic efficiency dominates depends on the industry context, making this the central evaluation point in any oligopoly essay.
This hub is updated regularly to reflect current IB Economics syllabus requirements.
Related Topics:
IB Economics your IB Economics daily guide
IB Economics Microeconomics access Oligopoly and Market Power content as well as the rest of module 2
IB Economics Diagrams Check Unit 13 for All Oligopoly and Market Power diagrams with explanations
IB Economics Market Power for contrasting Oligopoly and other forms of Market Power
IB Economics Activity book Module 2 Microeconomics Unit 2.17 for Oligopoly exam practice, activities, model answers and IB Economics Marking schemes
IB Economics Oligopoly containing all Oligopoly content in detail
IB Economics Profit Revenue and Costs - abnormal profit is the incentive for collusion; check the profit maximisation entry
IB economics Calculations Book make sure you check unit 12 for Oligopoly calculations exercises, IB model answers, and IB marking schemes
IB Economics Market Failure - oligopoly allocative inefficiency is a major real-world source of market failure; investigate this connection
IB Economics Government Intervention - cartel enforcement by the CMA and EU connects directly to government intervention in markets
IB Economics Paper 1 Guide - oligopoly and game theory are heavily examined at HL; cover the Paper 1 guidance
Read Next: IB Economics SL

© Theibtrainer.com 2012-2026. All rights reserved.
Legal
Have a Tip? Send us a tip using our anonymous form